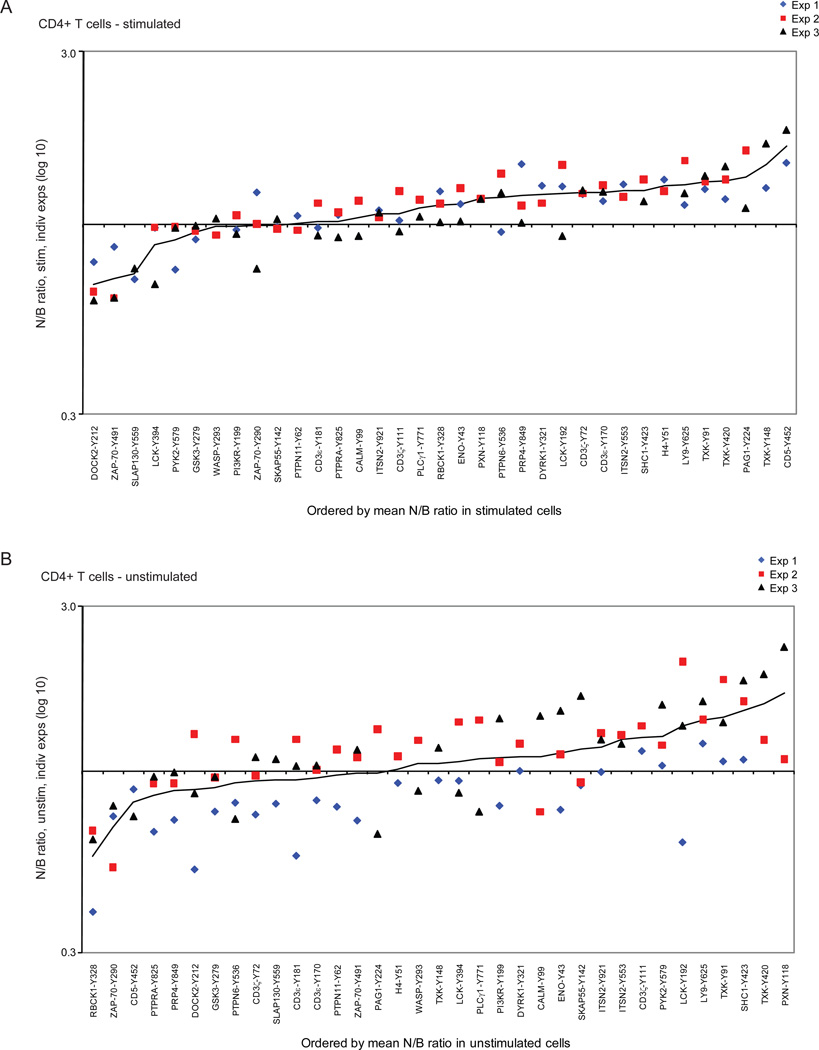
Figure 4.
Comparison of tyrosine-phosphorylation in peripheral CD4+ T cells from diabetes-susceptible NOD vs. –resistant B6g7 mice (a) stimulated or (b) unstimulated with anti-CD3 antibody. Proteins plotted by order of the mean of NOD (N) over B6g7 (B) ratio. Different colors represent different experiments. Protein tyrosine-phosphorylation sites are represented by Y-position of phosphorylation.

