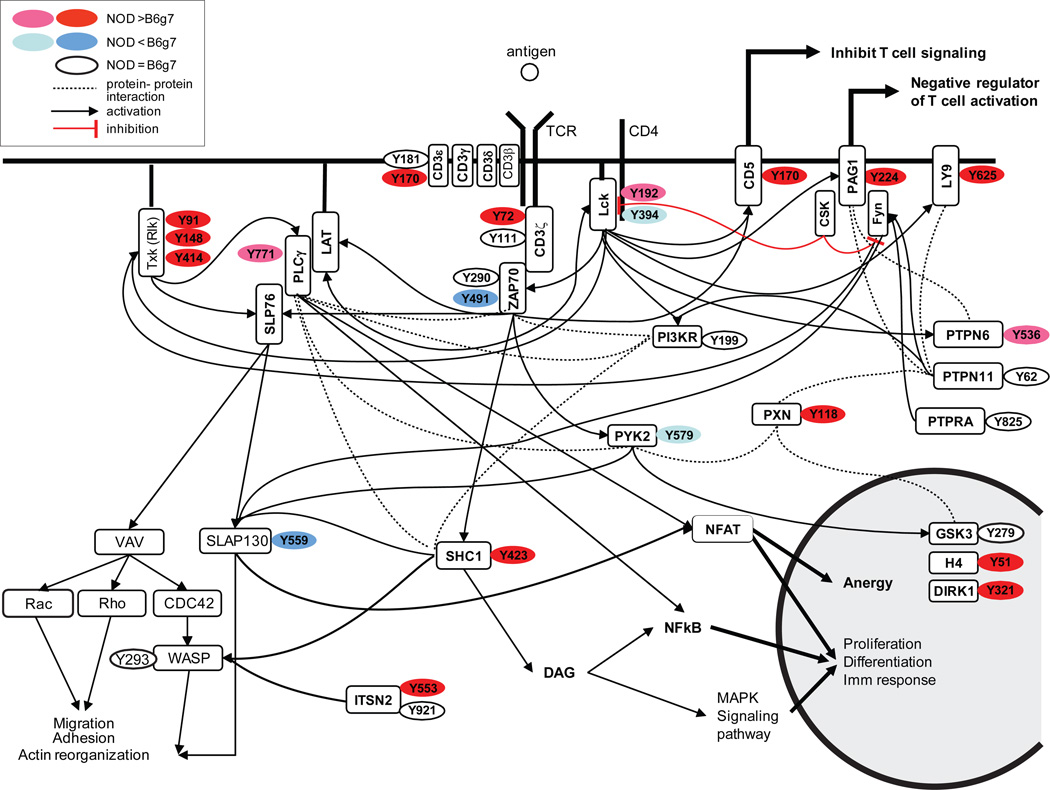
Figure 6.
T cell signaling pathways and protein phosphorylation sites identified to be differential between NOD and B6g7 mice in stimulated cells. In red: high tyrosine-phosphorylation upregulated in NOD; pink: low tyrosine-phosphorylation in NOD; blue: high tyrosine phosphorylation upregulated in B6g7; light blue: low tyrosine phosphorylation upregulated in B6g7; in white: tyrosine-phosphorylation equal in NOD and B6g7 (recompiled from KEGG Pathway database, Refs 33 and 34).

