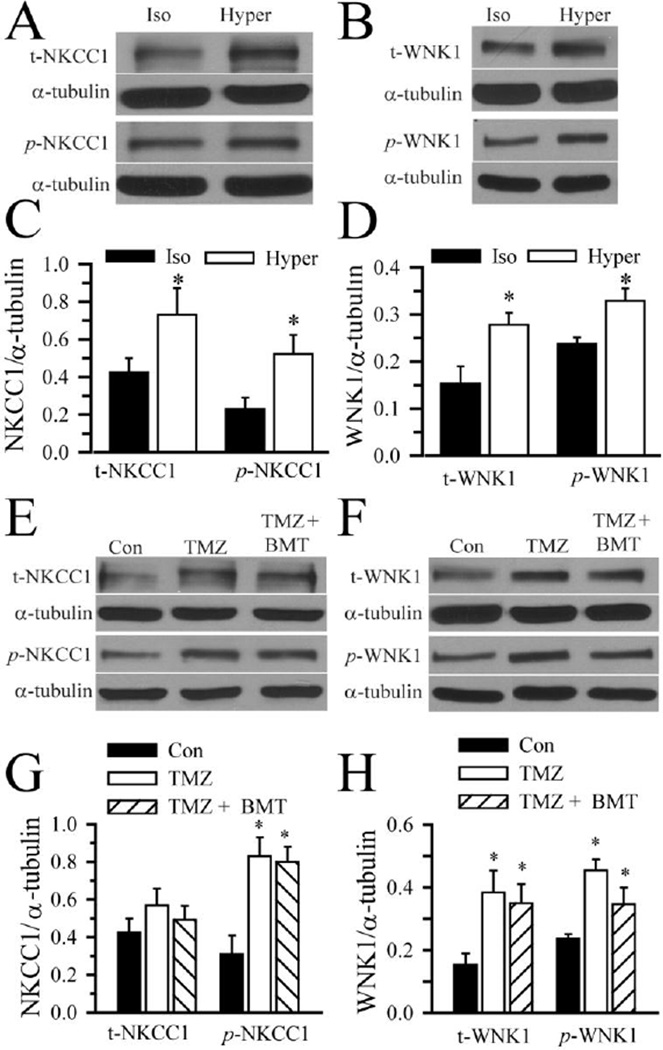
Figure 4. Activation of NKCC1 and WNK1 following osmotic stress and TMZ treatment.
A–D. GC (#22) were exposed to isotonic (310 mOsm) or hypertonic HEPES-MEM (370 mOsm) for 25 min. Expression of total NKCC1, total WNK1, phosphorylated NKCC1 (p-NKCC1), and phosphorylated WNK1 (p-WNK1) were evaluated by immunoblotting. A, B. Representative immunoblots showing expression of t-NKCC1, p-NKCC1, t-WNK1 and p-WNK1 protein under isotonic and hypertonic conditions. C, D. Summary data of immunoblotting. NKCC1/α-tubulin ratio (either t-NKCC1 or p-NKCC1) and WNK1/α-tubulin ratio (either t-WNK1 or p-WNK1) were calculated. Data are mean ± SD, n = 3–4, * p < 0.05 vs. Iso. E–H. GC (#22) were exposed to isotonic medium (Con), 100 µM TMZ, or TMZ plus 10 µM BMT for 4 h. Expression of t-NKCC1, t-WNK1, p-NKCC1, and p-WNK1 were evaluated by immunoblotting. E, F. Representative immunoblots. The pWNK1 control sample in F is the same isotonic control sample in panel B. G, H. Summary data of immunoblotting. NKCC1/α-tubulin ratio (either t-NKCC1 or p-NKCC1) and WNK1/α-tubulin ratio (either t-WNK1 or p-WNK1) were calculated. Data are mean ± SD. n = 3–4, * p < 0.05 vs. Con.

