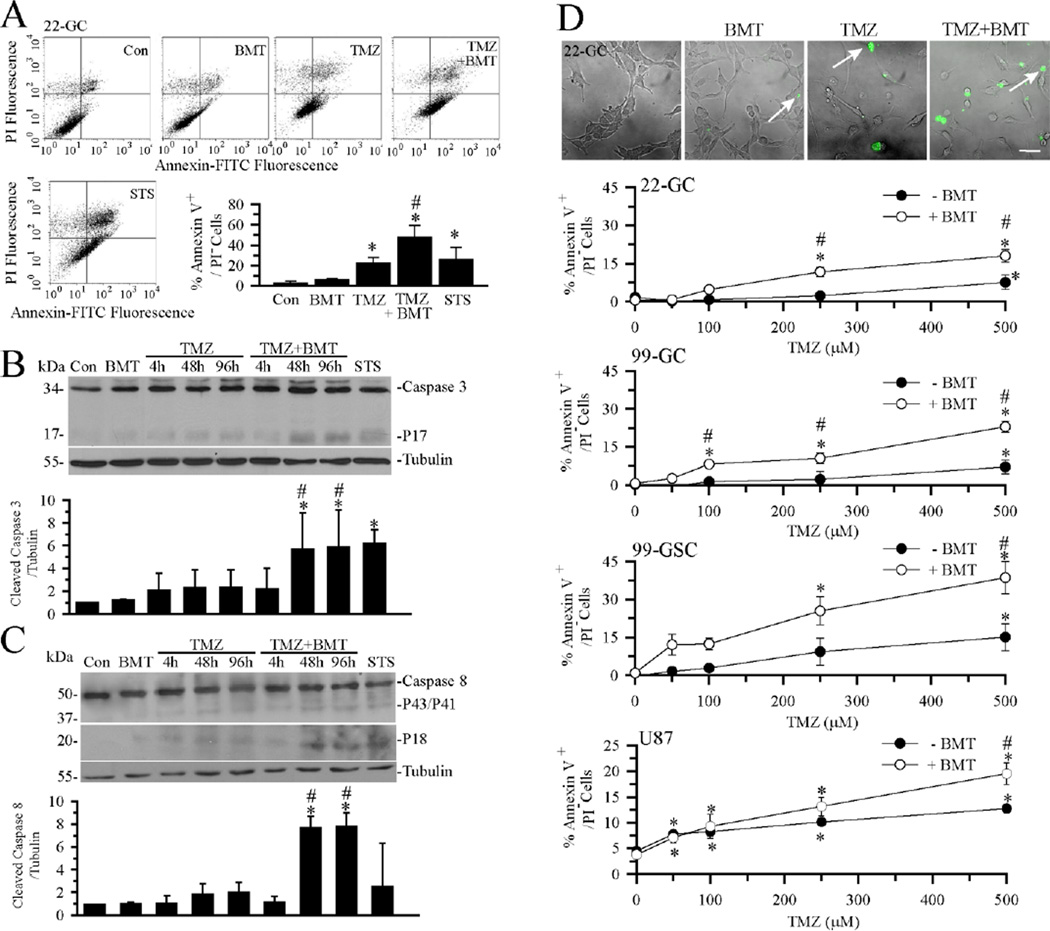
Figure 5. Blocking NKCC1 activity enhances TMZ-mediated apoptosis.
A. Apoptosis in GC (#22) was assessed by Annexin-V vs. PI staining in flow cytometry. GC were exposed to normal medium (Con), Con + 10 µM BMT, 500 µM TMZ, 500 µM TMZ + 10 µM BMT or 4 µM STS for 4 h. Representative dot-plots show viable cells (lower left quadrant), early apoptotic cells (lower right quadrant), and late apoptotic or necrotic cells (upper right quadrant). Bottom right hand panel: Summary data of cells with Annexin-V positive and PI-negative staining. Data are means ± SD, n = 3. * p < 0.05 vs. Con. # p < 0.05 vs. TMZ. B, C. Representative immunoblots and summary data of activated caspase-3 and caspase-8 in GC (#22) following exposure to normal medium (Con), Con + 10 µM BMT, 100 µM TMZ, 500 µM TMZ + 10 µM BMT or 4 µM STS for 4 h. Data are means ± SD, n = 3. * p < 0.05 vs. Con. # p < 0.05 vs. correspondent 100 µM TMZ. D. BMT sensitized GC and GSC to TMZ-induced phosphatidylserine externalization. Top panel: Early apoptotic cells (GC #22) are revealed by FITC-conjugated Annexin staining (arrow) under conditions of Con, Con + 10 µM BMT, 500 µM TMZ, or 500 µM TMZ + 10 µM BMT for 48 h. Scale bar = 50 µM. Lower panels: Summary data of TMZ dose-response curves at 48 h in GC (#22), GC (#99), GSC (#99), or U87MG. Data are means ± SEM. n = 3–6. * p < 0.05 vs. 0 mM TMZ, # p < 0.05 vs. corresponding BMT.

