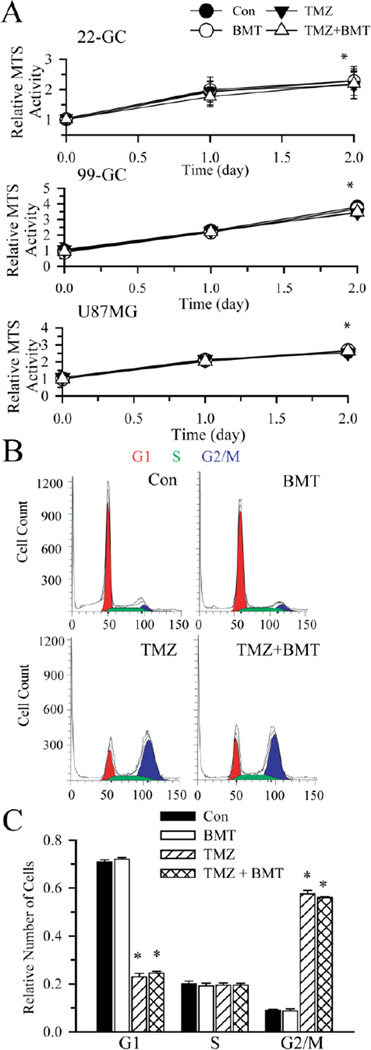
Figure 6. Cell proliferation and cell cycle arrest in the presence of TMZ.
A. Graphs of relative MTS activity in cells under each condition. Data are means ± SD. n = 3. * p < 0.05 vs. Con. B. Flow cytometric analysis of cell cycle distribution of GC (#22) cells treated with vehicle (DMSO), 10 µM BMT, 250 µM TMZ, 250 µM TMZ + 10 µM BMT for 96 h. The G1(red), S (Green), and G2/M (blue) phases are indicated. C. A summary graph of percent GC cells in each phase of cell cycle. Data are means ± SEM. n = 3. * p < 0.05 vs. Con.

