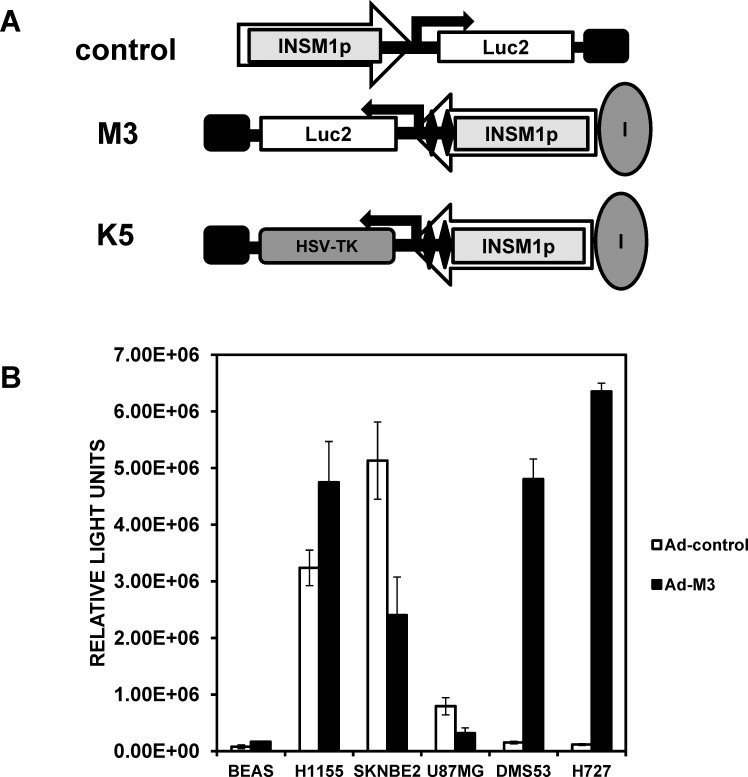
Figure 1.
Luciferase assays with Ad-C vs Ad-M3 virus in nonneuronal and neuroendocrine cell lines. (A) Schematic diagram of the various insulinoma-associated protein 1 (INSM1)-containing adenovirus constructs. The orientation of the INSM1 promoter transgene cassette with respect to the adenovirus E1A enhancer region is indicated by the large arrowheads. The large gray ovals represent the HS4 insulator element, the black diamonds indicate the 2× neuronal restrictive silencer elements (NRSEs), the small black rectangle denotes the SV40 poly-A tail, and the black direction arrows designate the start of transcription for the luciferase2 or herpes simplex virus thymidine kinase genes. (B) Ad-C virus and Ad-M3 virus multiplicity of infection (MOI) 100 were transduced into human INSM1-negative BEAS (bronchial epithelial) and U87MG (glioblastoma) cells and into the human INSM1-positive cell lines SK-N-BE(2) (neuroblastoma), NCI-H1155 (non–small-cell lung cancer with neuroendocrine differentiation), NCI-H727 (carcinoid), and DMS53 (small-cell lung cancer); incubated for 48 hours; and assayed for luciferase activity using the ONE-Glo luciferase reagent. All data represent the average of at least 3 experiments performed in triplicate. The luciferase activity is reported as relative light units measured on a TopCount NXT scintillation and luminescence reader.

