
Figure 3.
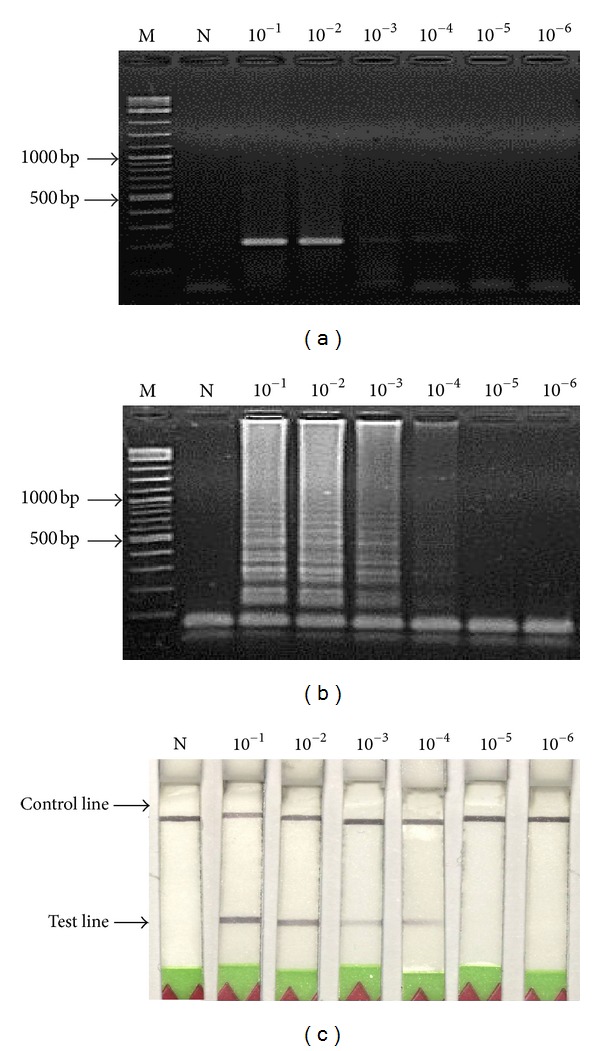
Detection sensitivity data of MTB genomic DNAs at concentration range of 10−1 to 10−6 dilutions (initial concentration was 50 ng) obtained from (a) PCR, (b) LAMP, and (c) LAMP-LFD. Lanes M and N represent DNA ladder marker and negative control (no-DNA template), respectively.