Figure 1:
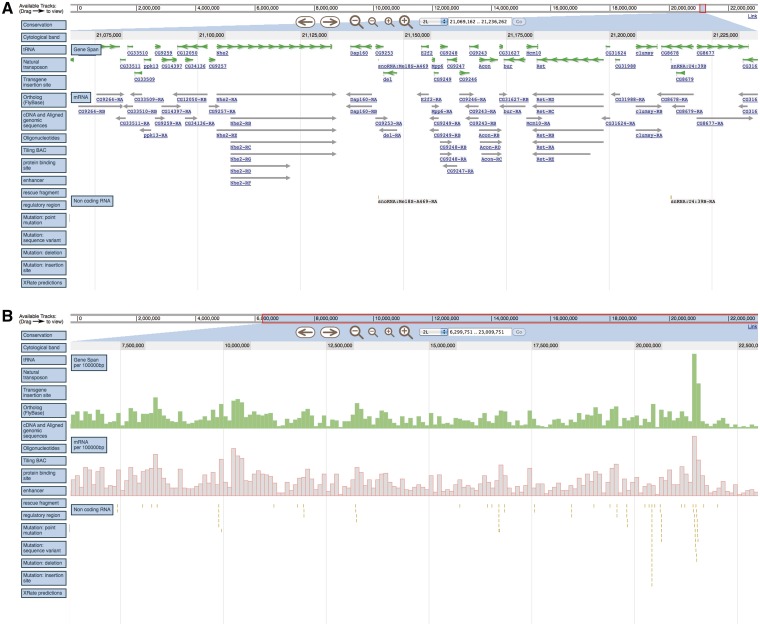
Semantic zooming uses different representations of the same data to maximize the ease of user interpretation across a broad range of zoom levels. When viewing a region of <200 kb in (A), individual genes and mRNA features are shown. When zooming out to a 7 mb region in (B), these two tracks are collapsed to histograms showing the frequency of each within 100 kb regions. Since non-coding RNA features are sufficiently sparse, they are still individually displayed at both zoom levels (as small vertical lines), but their individual labels are omitted for readability.

