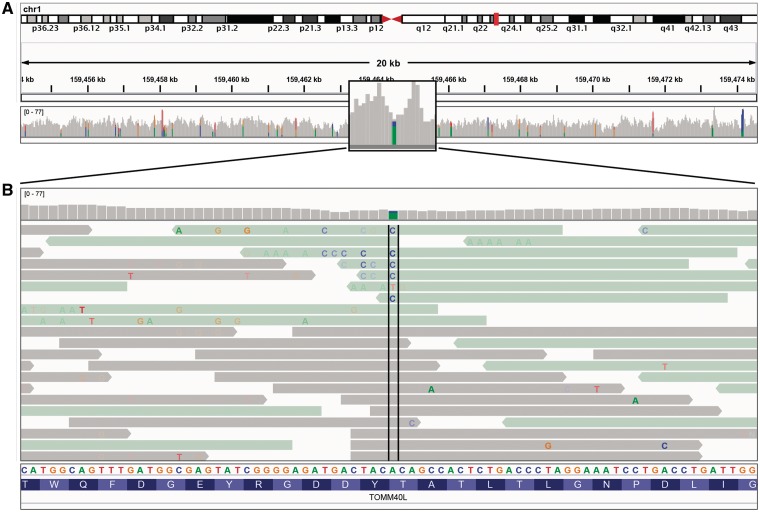
Figure 4:
Read alignment views at 20 kb and base pair resolution. IGV displays varying level of data detail depending on the zoom level, and uses color and transparency to highlight interesting events in the data. (A) Reads are summarized as a coverage plot. Positions with a significant number of mismatches with respect to the reference are highlighted with color bars indicative of both the presence of mismatches and the allele frequency. (B) Individual base mismatches are displayed with alpha transparency proportional to quality. In this example, the reads have been sorted and colored by strand.

