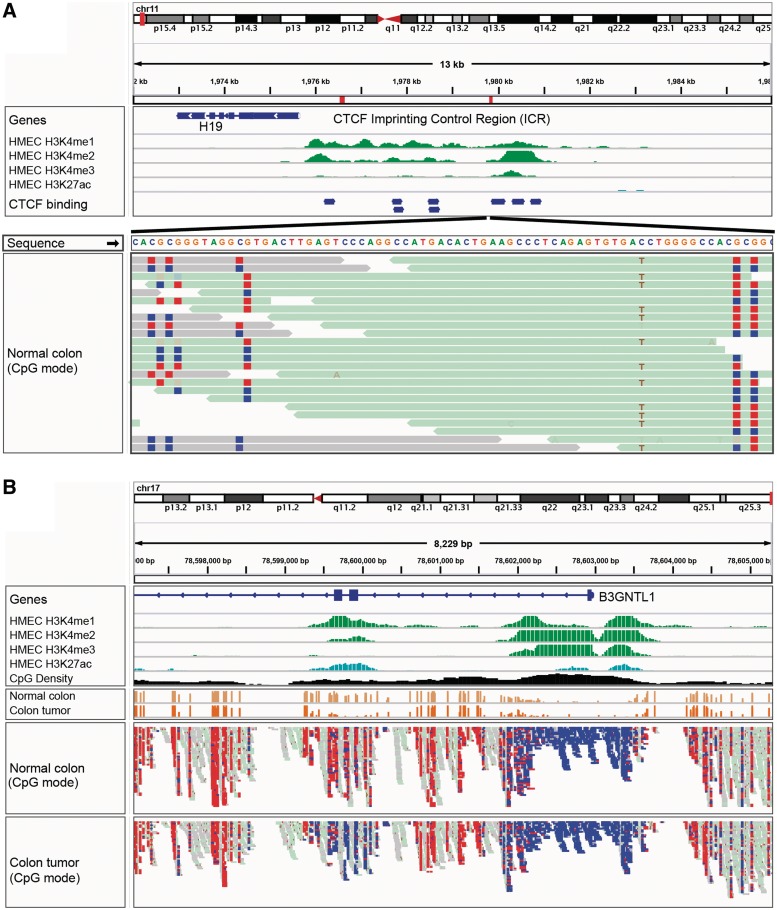
Figure 5:
IGV bisulfite sequencing view. (A) Two views of the IGF2/H19 Imprinting Control Region (ICR), illustrating allele-specific methylation of CTCF binding sites. The top view shows a 13-kb region of ChIP-seq histone marks from the ENCODE normal epithelial tissue (HMEC) cell line. The second view shows WGBS read alignments from normal colonic mucosa [19], zoomed in to 75 bp. CpG dinucleotides are shown as blue (unmethylated) and red (methylated) squares. A heterozygous C/T SNP is also apparent, and the T allele is overwhelmingly associated with reads that have methylated CpGs (from the paternal chromosome). (B) The enhancer region surrounding exons 2 and 3 of the B3GNTL1 gene is apparent from the ENCODE tracks showing characteristic enhancer histone marks in a normal epithelial (HMEC) cell line. The bisulfite sequencing view of the read alignments shows that this enhancer is methylated (red – lighter) in normal colon mucosa, but almost completely unmethylated (blue – darker) in the matched colon tumor sample [19]. The cancer-specific de-methylation of this enhancer is consistent with the upregulation of the B3GNTL1 transcript in the tumor.

