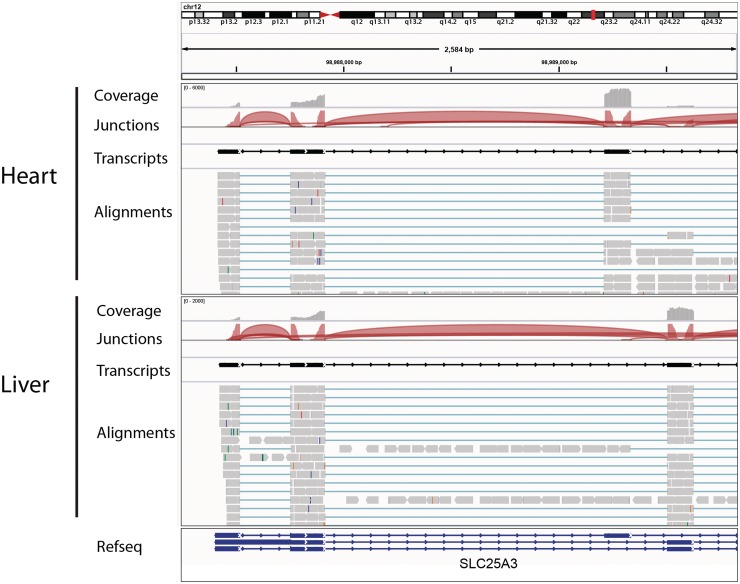
Figure 6:
Visualization of RNA-seq data from heart and liver tissue samples. Each panel includes tracks for total coverage, junction coverage, predicted transcripts and read alignments. Reads that span junctions are connected with thin blue lines. In the junction track, the height of each arc is proportional to the total number of reads spanning the junction. There is clear evidence of alternative splicing between the two tissues.

