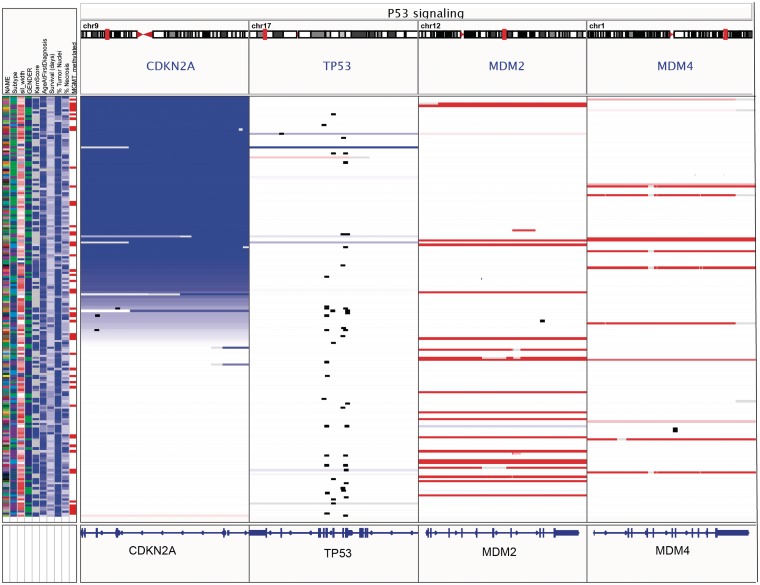
Figure 7:
Gene-list view of copy number, mutation and clinical data from 202 glioblastoma samples from the TCGA project. The IGV window has been split into panels corresponding to four genes from the p53 signaling pathway. Copy number is indicated by color, with blue denoting deletion and red amplification. Mutations are overlaid as small black rectangles. The samples have been sorted by copy number of CDKN2A. In this view it is apparent that deletion of CDKN2A and mutation of TP53 tend to be mutually exclusive.

