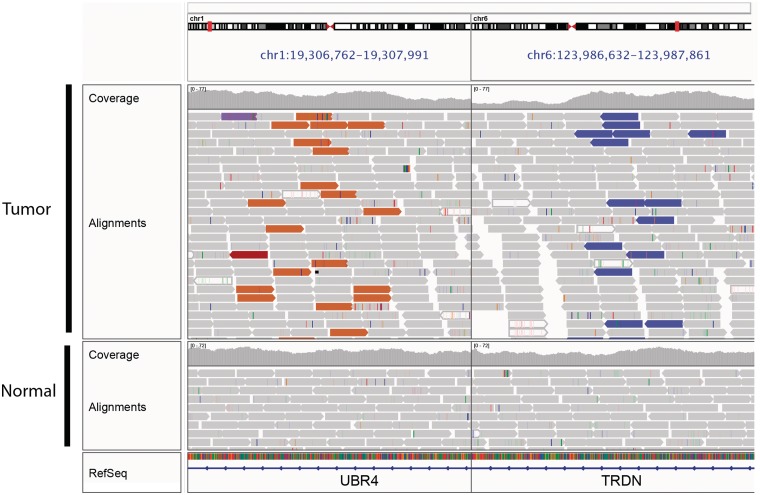
Figure 8:
Split-screen view of read alignments from a glioblastoma multiforme tumor sample and matched normal, displaying regions of chromosomes 1 and 6. In this example, alignments whose mate pairs are mapped to unexpected locations are color-coded by the chromosome of the mate; other alignments are displayed in light gray. The brown alignments on the left panel and purple alignments on the right are matepairs, indicating a fusion between these loci. There is no evidence of this rearrangement in the matched normal.

