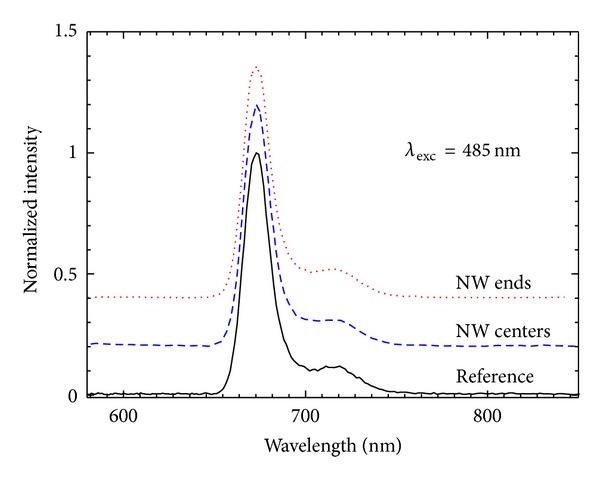
Figure 8.

Fluorescence spectra of PCP complexes deposited on Ag nanowires measured for the mixed sample under excitation wavelength of λ exc = 485 nm. Data obtained for the laser spot placed at the end of the nanowire (dotted line), along the nanowire (dashed line), and off the nanowire (solid line).
