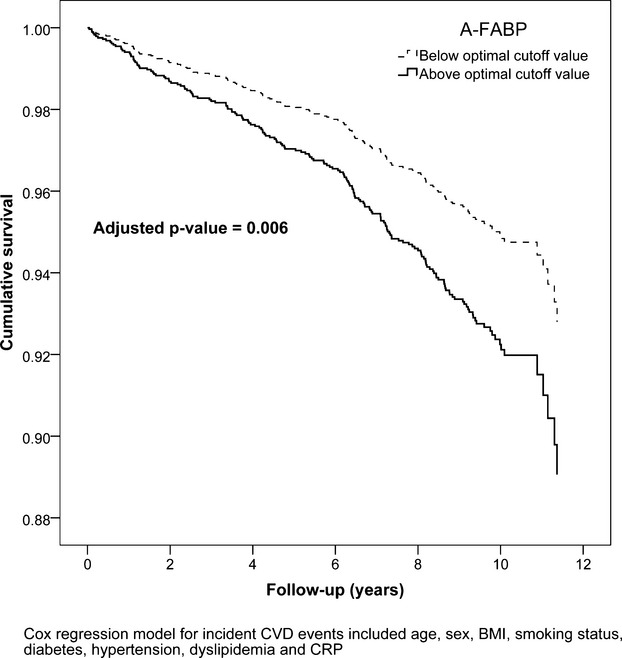
Figure 1.

Cumulative survival curve of incident CVD over 12 years, based on the Cox proportional hazards model, in subjects above and below the optimal cutoff values of A‐FABP. CVD indicates cardiovascular disease; A‐FABP, adipocyte‐fatty acid binding protein; BMI, body mass index; CRP, C‐reactive protein.
