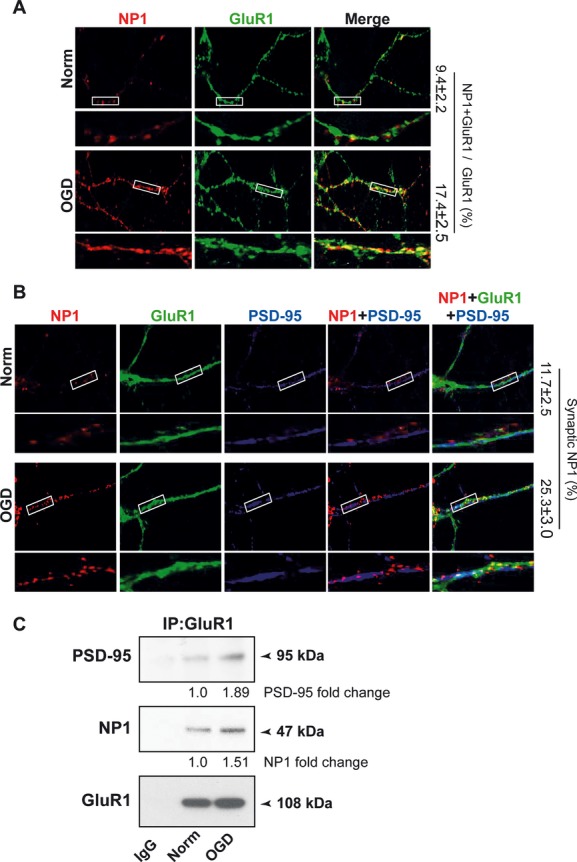
Figure 3.

OGD enhances interaction between NP1 and GluR1 at synaptic sites. A, Live immunostaining of hippocampal neurons with NP1 and GluR1 following OGD (2 hours). Quantitative analyses show the percentage of the NP1‐GluR1 colocalized clusters in the respective images (P<0.05). B, NP1 (red), GluR1 (green), and PSD‐95 (blue) colocalize at hippocampal dendrites. Quantitative analyses show the percentage of the colocalization of NP1 and PSD‐95 (synaptic NP1) (P<0.01). C, WB of GluR1 immunoprecipitates show increases in NP1 and PSD‐95 co‐precipitation in response to OGD. Quantification of the band intensity is depicted at the bottom of the blots. OGD indicates oxygen glucose deprivation; NP1, neuronal pentraxin 1; WB, Western blot; PSD, postsynaptic density.
