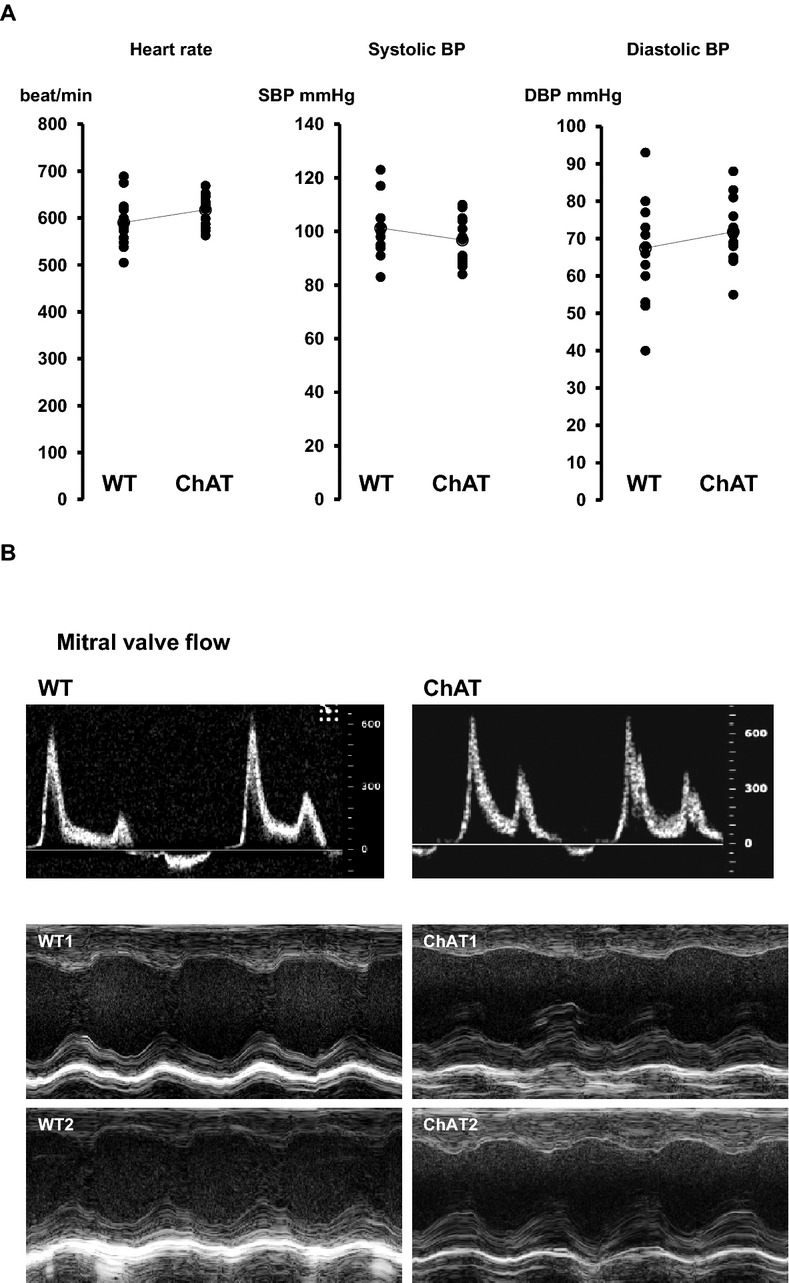
Figure 3.

Comparison of heart rate (HR) and blood pressure (BP) and echocardiographic findings. A, There were no significant differences between WT and ChAT‐tg mice with regard to HR (590.5±14.4 vs 617.6±9.4 bpm, P=0.1811, n=13), systolic BP (101.3±2.6 vs 96.8±2.1 mm Hg, P=0.4592, n=15), and diastolic BP (67.5±3.4 vs 71.8±2.1 mm Hg, P=0.1162, n=15). B, Top panel: WT and ChAT‐tg hearts showed a similar pattern for mitral valve flow. Middle and bottom panels: Representative M‐mode echocardiograms of the left ventricles of the WT and ChAT‐tg mice (2 cases in each group). See Table 1 for details. WT indicates wild‐type; ChAT‐tg, choline acetyltransferase transgenic; bpm, beats per minute.
