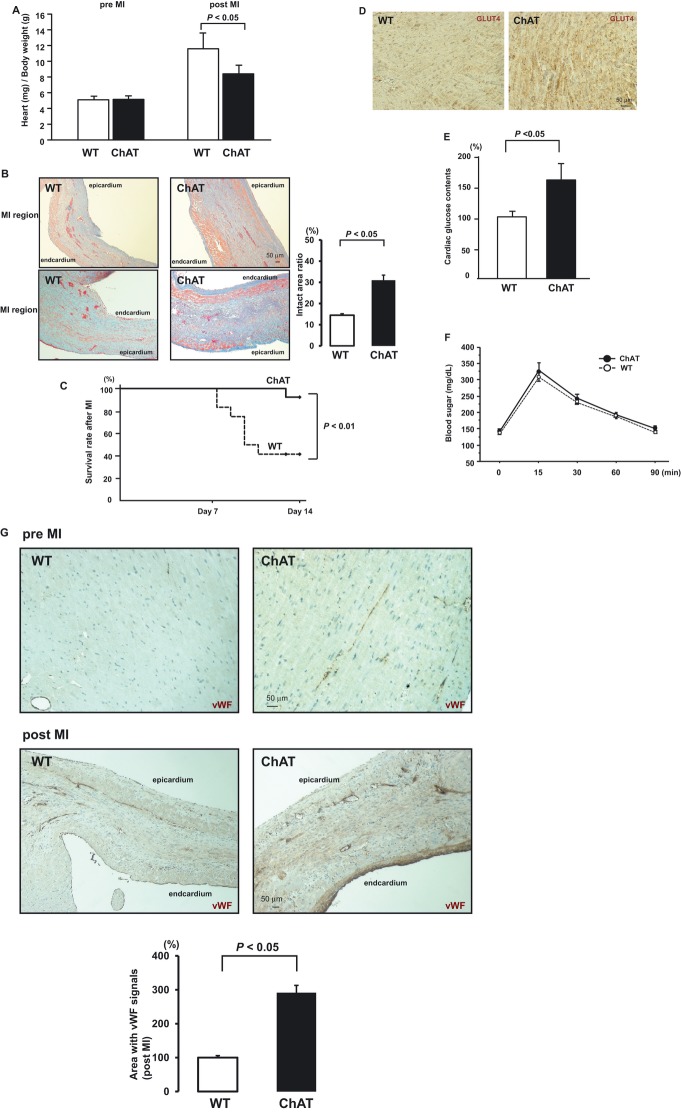
Figure 5.
Effects of overexpression of heart‐specific ChAT on cardiac remodeling, glucose uptake, angiogenesis, and survival after myocardial infarction (MI). A, Heart‐to‐body weight ratio 2 weeks after MI. The weight ratio in the ChAT‐tg mice was significantly decreased compared with that in the WT mice (P=0.0319, n=10). B, Histological examination by Masson's trichrome stain. More viable myocardium (red) was observed in the layer of the ischemic left ventricular wall of the ChAT‐tg mouse than in the WT mouse, specifically in the subendothelial and subepithelial regions (P=0.0103, n=8); in contrast, the ischemic region of the WT infarcted heart was transmurally replaced with fibrous tissues. Scale bar=50 μm. C, Kaplan–Meier survival analysis of mice after MI within 14 days. ChAT‐tg mice showed a better survival rate than the WT mice after myocardial infarction (92.3% vs 41.7%, P=0.0048, n=13). D, Glut‐4 immunoreactivity in the myocardium was greater in the ChAT tg heart than in the WT mouse heart. Representative data are shown from the WT and ChAT‐tg hearts (n=6). Scale bar=50 μm. E, Glucose content in the ChAT tg heart was increased compared with that in the WT mouse heart (P=0.0379, n=5). F, A glucose tolerance test administered through intraperitoneal injection showed comparable blood glucose levels in the ChAT‐tg mouse and the WT mouse (n=4 each). G, von Willebrand factor (vWF)–positive cells were very few in the left ventricular wall of the WT sham‐operated mice, but a certain number of the cells in that of the ChAT‐tg sham‐operated mice (5G, pre‐MI ChAT). After MI, vWF‐positive cells and vascular structures more efficiently grew in the ischemic area, particularly in the ChAT‐tg heart compared with the WT heart (P=0.0131, n=6). Such an angiogenic image was specifically observed around and in the infarcted area. Compared with the WT infarcted heart, the ChAT‐tg infarcted heart showed an intense angiogenic response to MI (G, post‐MI ChAT). Scale bars=50 μm. ChAT‐tg indicates choline acetyltransferase transgenic; MI, myocardial infarction; WT, wild type.

