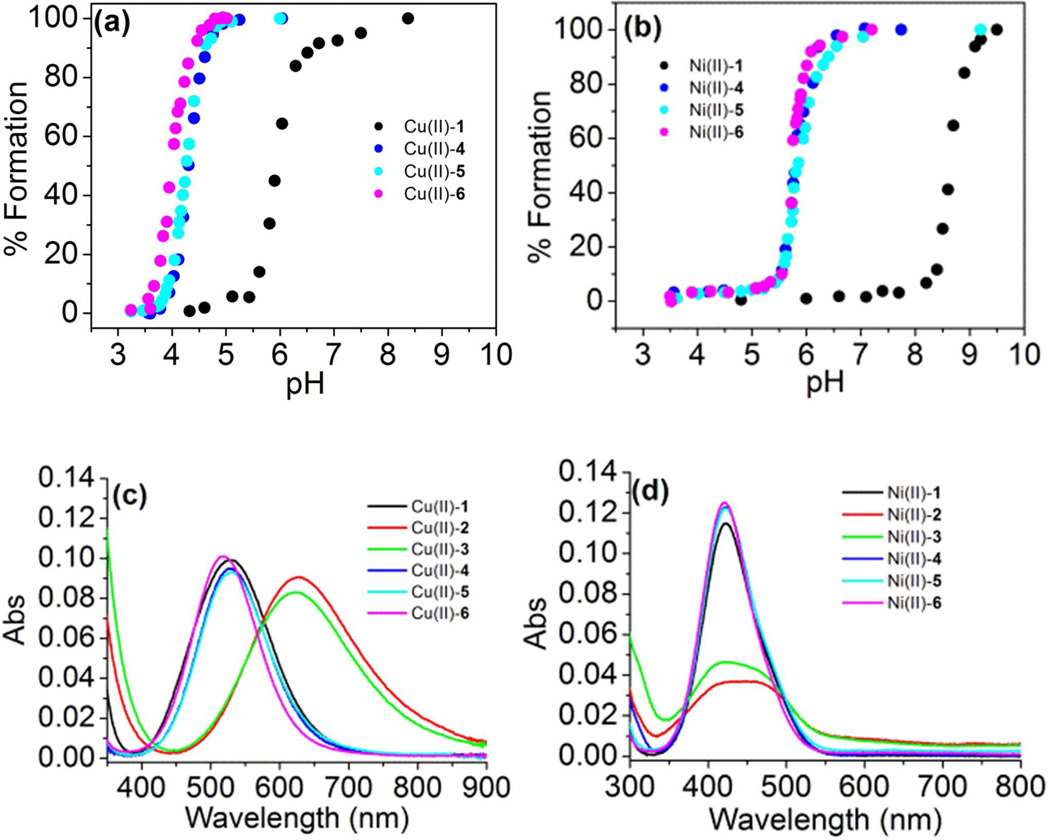
Figure 2. UV-vis spectroscopy of metal-binding peptides.
(a) pH dependence of Cu(II) binding to macrocycles and linear analogs. (b) pH dependence of Ni(II) binding to macrocycles and linear analogs. For pH titrations, UV-vis absorbance was monitored as pH was increased with dilute KOH, and normalized absorbance at λmax is plotted against experimentally measured pH. (c) UV-vis spectra of Cu(II)-peptide complexes at pH=7.5. (d) UV-vis spectra of Ni(II)-peptide complexes at pH=9.5. All UV-vis spectra were taken using a solution of 1.0 mM metal-peptide complex in 50 mM N-ethylmorpholine buffer at 25 °C. Data for metal complexes of peptide 1 are shown in black, 2 in red, 3 in green, 4 in blue, 5 in cyan, and 6 in magenta.

