Figure 1.
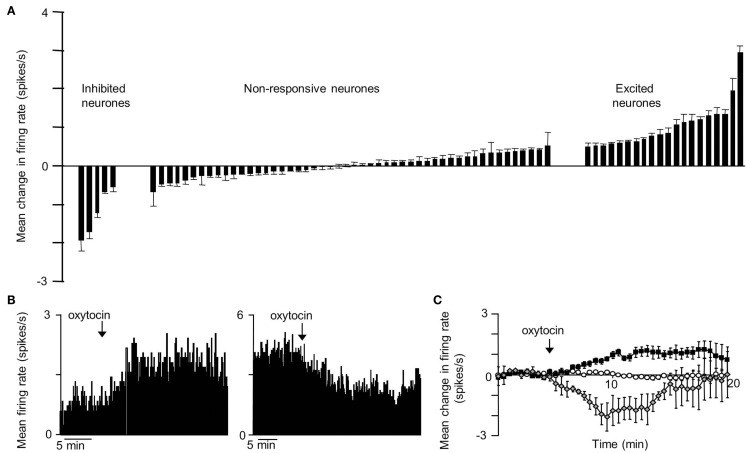
Responses to icv oxytocin in VMN neurons in vivo. Single VMN neurons were recorded extracellularly from the VMN of urethane-anesthetized rats (Sabatier and Leng, 2008). (A) Each bar represent the mean change in firing rate (±SD) averaged over the first 10 min after icv injection of oxytocin (1–10 ng) in each VMN cell tested. The cells are ranked by response magnitude and are classed as inhibited, non-responsive, and excited according to whether the responses were significant or not. (B) Representative example of an inhibition (left panel) and activation (right panel) of the mean firing rate in response to icv oxytocin in a single VMN cell recorded extracellularly. (C) Mean change in firing rate (±SE) in the VMN cells that were significantly activated  ; n = 14), significantly inhibited
  ; n = 4), and not significantly affected
  ; n = 43) by icv oxytocin.

