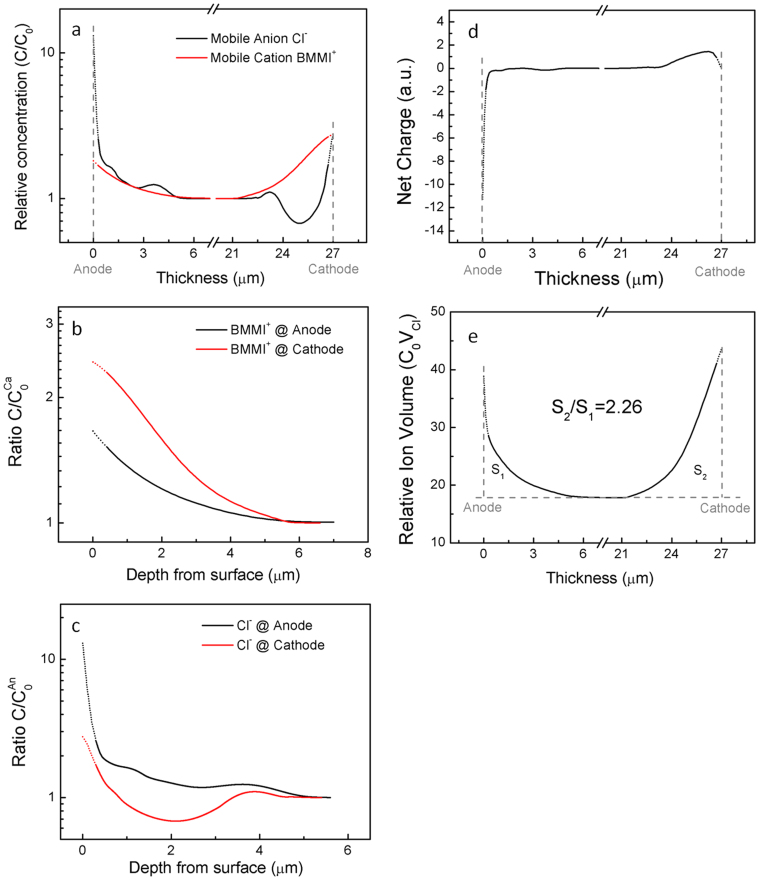
Figure 5. Data analysis of ion depth profiles.
(a) Mobile cation and anion concentration with respect to the middle region in log scale. Due to the presence of negatively charged side groups in Aquivion, about 20% of cations in the entire systems are attached to the side groups, and hence are considered immobile. (b) Depth profile of cation and (c) depth profile of anion near electrodes in log scale to show details. Surface roughness regions (d ~ 170 nm) are fitted from the rest of the curves (d > 170 nm), and thus presented with doted lines (see Supplementary Information). (d) and (e) are net charge and relative ion volume through the entire actuator thickness.

