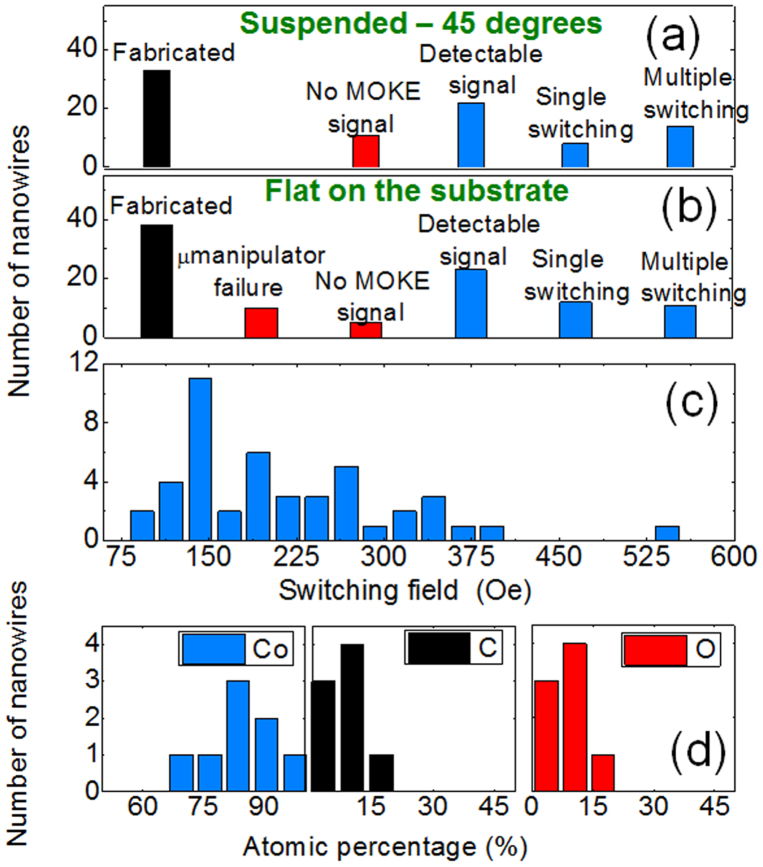
Figure 5. Statistics of the processes carried out for this work.
(a) and (b) Histograms regarding growth, micromanipulation and magnetic signal of the wires. MOKE data refer to loops with 1000 averages (c) Histogram of the switching fields of the wires. (d) Histograms of the atomic composition of the wires.

