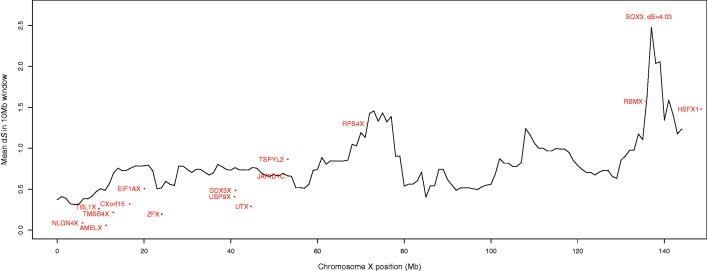
Fig. 1.
Pairwise synonymous substitution rate across chromosome X. The pairwise Xgene–Ygene and Xgene–Ypseudogene synonymous substitution rates (dS) are plotted across the entire X chromosome in 10 Mb sliding windows, sliding by 1 Mb. We observe a trend from smaller dS values to larger dS values as we move from the short arm of the X chromosome (where the newest strata are located) to the end of the long arm (where the oldest strata are located) but do not identify strict boundaries using this method. For reference, the dS of X-linked genes with functional Y homologs (excluding the XTR) are plotted separately in red.

