
Fig. 2.
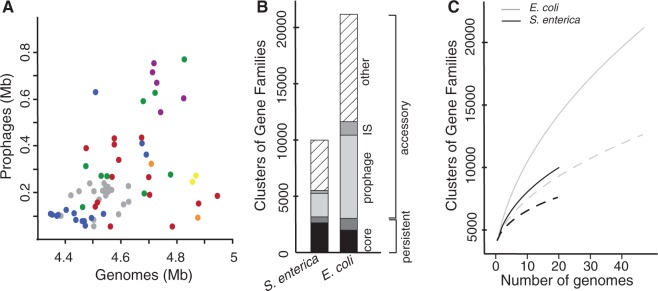
Contribution of prophages to chromosome plasticity. (A) Scatter plot of cumulative size of resident prophages against the size of the host genome (Spearman's ρ = 0.52, P < 0.0001). Colors correspond to the phylogenetic groups as in figure 1. (B) Fraction of the core, persistent, and accessory genes in the pan genome of Salmonella enterica (left) and Escherichia coli (right). The core genome corresponds to the genes present in all strains, the persistent genome to the genes present in more than 90% of the strains. The accessory genome is split in three categories: the prophages, the insertion, sequences (IS), and the other genes. (C) Escherichia coli (in gray) and S. enterica (in black) pan genomes according to the number of sequenced genomes. The dotted lines correspond to pan genomes after removing prophage elements.