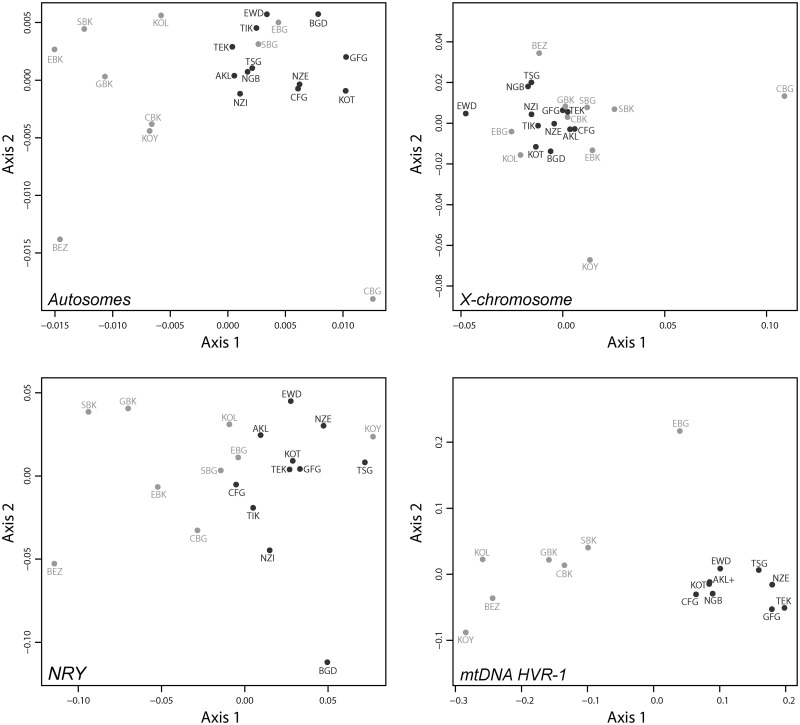
Fig. 2.
Two-dimensional metric MDS based on population pairwise genetic distances. Pairwise genetic differentiation were estimated as FST (Weir and Cockerham 1984) and set to 0 when found not significant based on 10,000 permutation tests. Matrices of pairwise FST are then projected in a two-dimensional space using a metric MDS approach (Axis 1 = first principal coordinate, Axis 2 = second principal coordinate). Upper-left plot: pairwise FST for 28 autosomal microsatellites, Spearman’s ρ = 0.82 (see Materials and Methods). Upper-right plot: pairwise FST for eight X-chromosome microsatellites, Spearman’s ρ = 0.67. Lower-left plot: pairwise FST for six NRY microsatellites, Spearman’s ρ = 0.69. Lower-right plot: pairwise FST for mtDNA HVR-1 359 bp sequences, Spearman’s ρ = 0.98. Pygmy populations are indicated in light gray and non-Pygmy populations in dark gray. See population codes in table 1.

