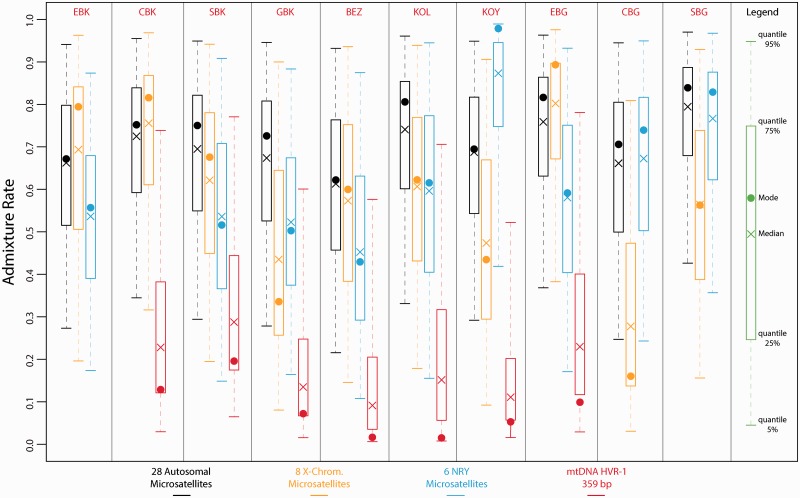
Fig. 5.
Posterior distributions of the rate of genetic introgression from non-Pygmy populations into each Pygmy population using ABC analyses. Posterior distributions were obtained considering the three-population models described in supplementary figure S2, Supplementary Material online. For each one of the four chromosomal types, we simulated separately one million data sets for all the analyses involving a different pair of Pygmy populations (together with the corresponding non-Pygmy neighboring population see Materials and Methods and supplementary fig. S2, Supplementary Material online). For each Pygmy population and each chromosomal type separately, posterior distributions of the level of genetic introgression from the non-Pygmies were estimated based on the 10,000 (1%) top simulations providing summary statistics closest to the observed data. To obtain a single posterior distribution for a given Pygmy population and a given chromosomal type, we merged the corresponding posterior distributions obtained for the ABC analyses considering that particular Pygmy population (see Materials and Methods). The color code is the same as in figures 3 and 4. See table 1 for population codes.

