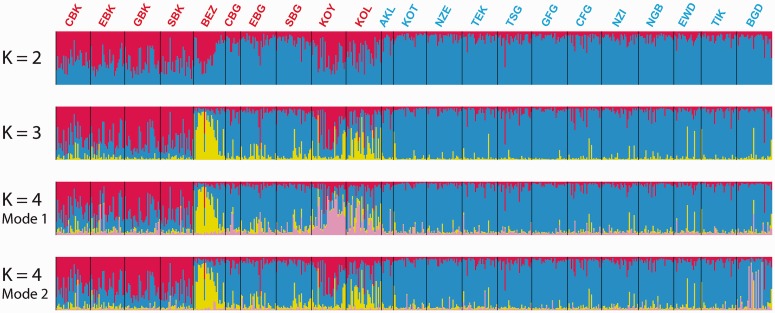
Fig. 6.
Individual clustering of Central African Populations using autosomal and X-chromosome microsatellites. Each individual in the data set is represented by a single vertical line divided into K colors corresponding to the proportion of their genotype clustering in each one of the K pre-assumed clusters obtained with STRUCTURE v2.3 (Pritchard et al. 2000; Falush et al. 2003), using 28 autosomal and eight X-chromosome microsatellites. The number of pre-assumed clusters K is indicated on the left of each bar plot. See table 1 for population codes. Pygmy population codes are indicated in red and non-Pygmy in blue. At K = 2, all 40 runs (see Materials and Methods) provided results that belonged to the same mode [average ln(Probability of observing the data) = −63,164.2, SD = 13.0]. At K = 3, 21 runs out of the 40 belonged to the same mode (presented here) with a higher average likelihood [average ln(Probability of observing the data) = −63,250.0, SD = 231.7] than that of the 19 runs belonging to the second mode [average ln(Probability of observing the data) = −63,328.0, SD = 232.4]. This alternate mode was however highly uninformative (result not shown). At K = 4, we found two informative modes among the 40 runs: one comprising 15 runs out of the 40 [mode 1, average ln(Probability of observing the data) = −63,947.4, SD = 903.5]; one comprising five runs out of the 40 [mode 2, average ln(Probability of observing the data) = −63,795.5, SD = 1,078.8]. The last mode found at K = 4 comprised 20 runs out of 40 and was highly uninformative (result not shown). No further clear population-specific genetic structure was found at K = 5 and higher (result not shown) Results were plotted using DISTRUCT (Rosenberg 2004).

