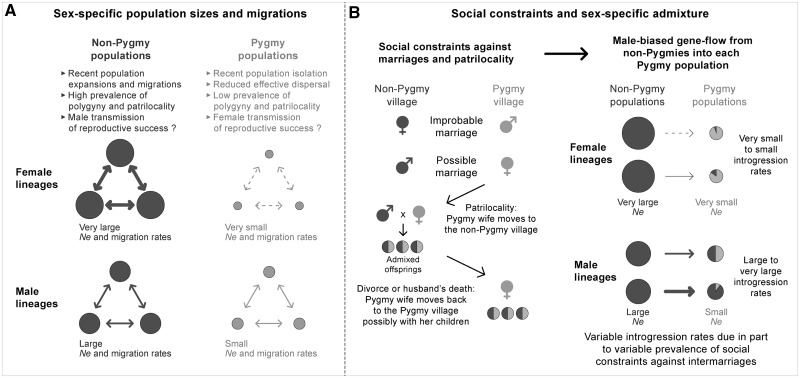
Fig. 7.
Schematic representation of the influence of historical and sociocultural factors on the sex-specific demography of Central African Pygmy and non-Pygmy populations inferred from genetic data. Non-Pygmy populations are represented in dark gray and Pygmy populations in light gray. Circle sizes are schematically proportional to effective population sizes (indicated by “Ne”). Arrow sizes represent schematically the intensity of migrations between populations in (A), and the intensity of genetic admixture in (B). ♀ represents women and ♂ represents men. (A) Sex-specific effective population sizes and migrations among non-Pygmy and Pygmy groups of populations, respectively. (B) How complex gender-related sociocultural behaviors regarding barriers against intermarriages and discriminations between Pygmies and non-Pygmies result in male-biased asymmetric gene flow from non-Pygmies in each Pygmy population in a context of patrilocality.

