
Fig. 1.
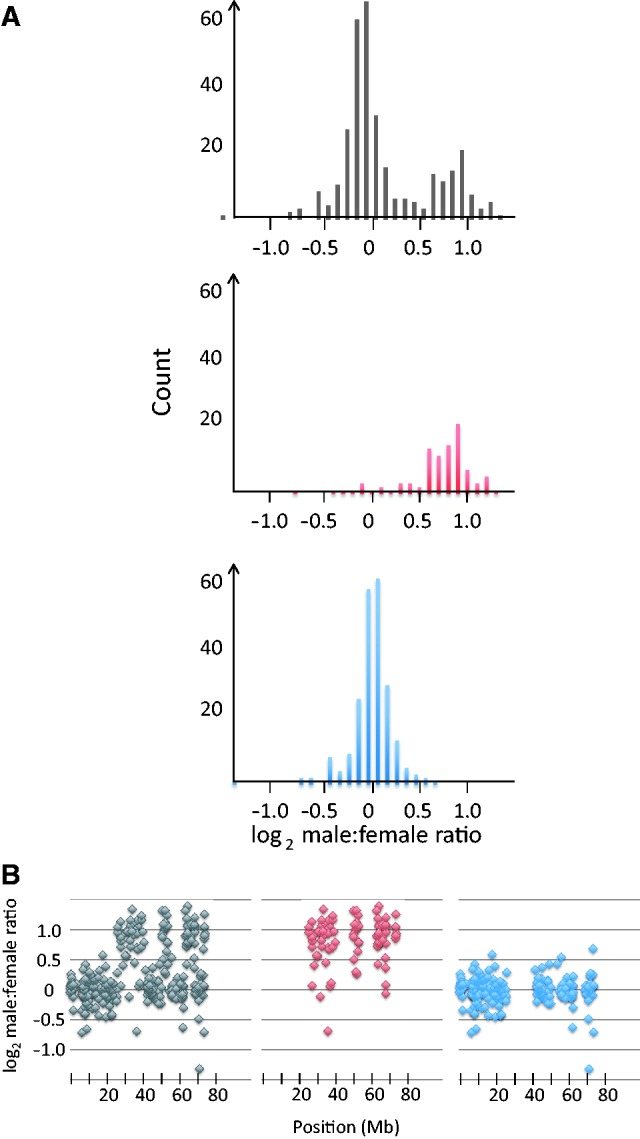
Distribution of the male-to-female expression ratio in ostrich brain for Z-chromosome genes. (A) Distribution of the male:female expression ratio for all genes (black), 93 genes from clusters with a 2-fold excess of male expression (red), and 222 genes from clusters with equal expression in males and females (blue). (B) Expression ratio plotted according to start position on the chicken Z-chromosome showing all genes (black), genes from clusters with a 2-fold excess of male expression (red), and genes from clusters with equal expression in males and females (blue).