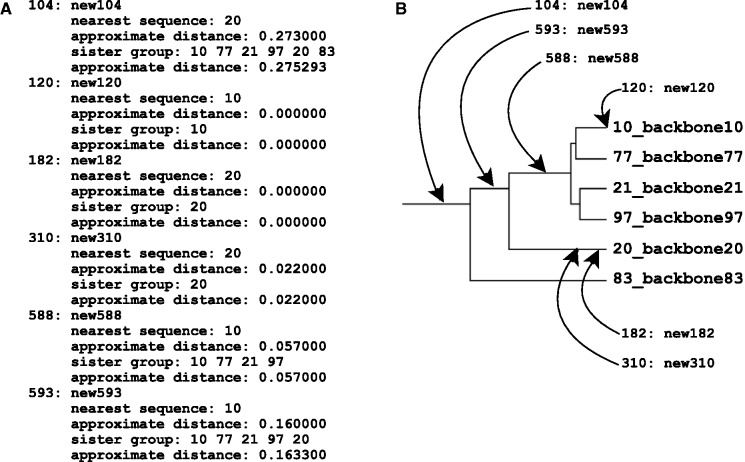
Fig. 3.
(A) A part of output of the ––treeout option showing the phylogenetic positions of new sequences (new#) in the tree of the existing alignment (backbone#), estimated before the alignment calculation. This file also shows a Newick format tree of the existing alignment (not shown in this figure). For each new sequence, the nearest sequence in the existing alignment (nearest sequence), approximate distance to the nearest sequence (approximate distance), and the members of the sister group (sister group) are shown. (B) Graphical representation of (A).

