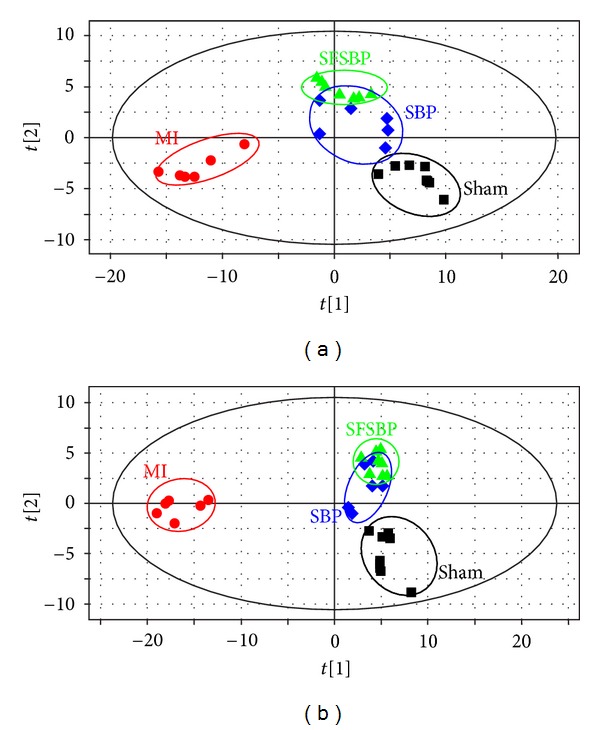
Figure 6.

PLS-DA score plots of rat serum on day 15 in positive and negative modes. (a) PLS-DA score plot of rat serum of the SFSBP group in positive mode (R 2 X (cum) = 0.596, R 2 Y (cum) = 0.977, Q 2 Y (cum) = 0.573); (b) PLS-DA score plot of rat serum of the SFSBP group in negative mode (R 2 X (cum) = 0.516, R 2 Y (cum) = 0.975, Q 2 Y (cum) = 0.583).
