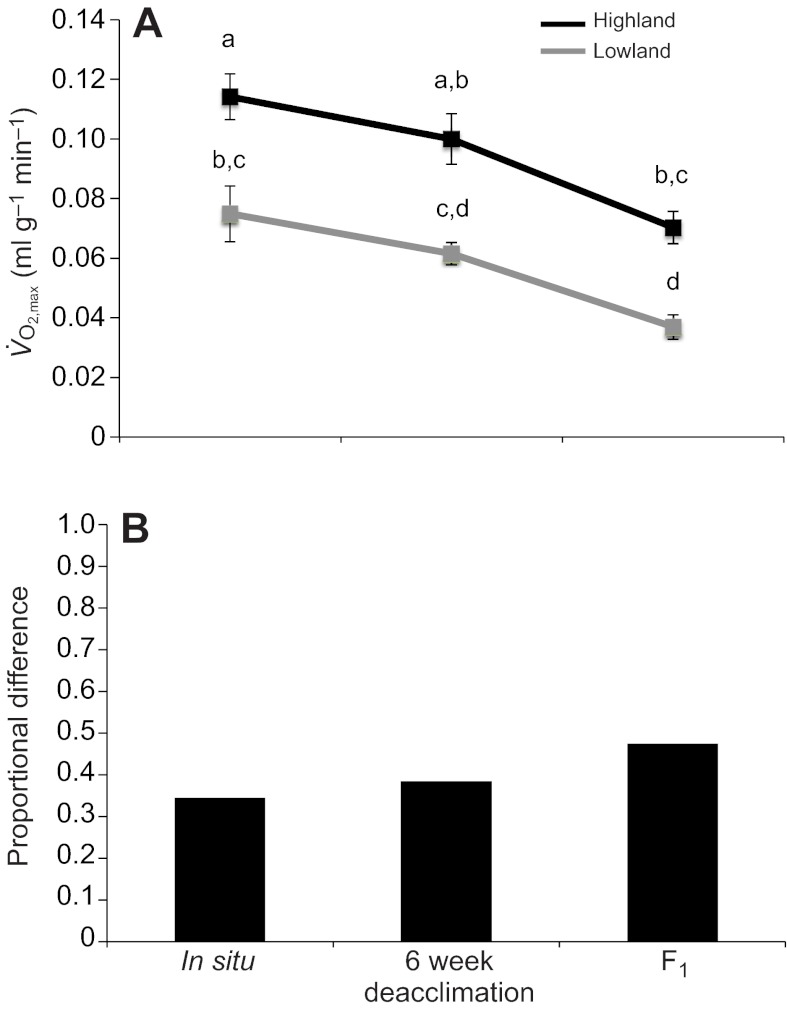
Fig. 1.
(A) Mass-specific maximum rates of oxygen consumption ( ) under hypoxic cold stress for highland and lowland deer mice (Peromyscus maniculatus) across the three treatments (in situ, 6 week deacclimation and F1 progeny of deacclimated mice). Different letters denote population and treatment combinations that are significantly different from one another. Data are presented as means ± 1 s.e.m. (B) The proportional difference
  in
in  between highland (HA) and lowland (LA) deer mice across treatments.

