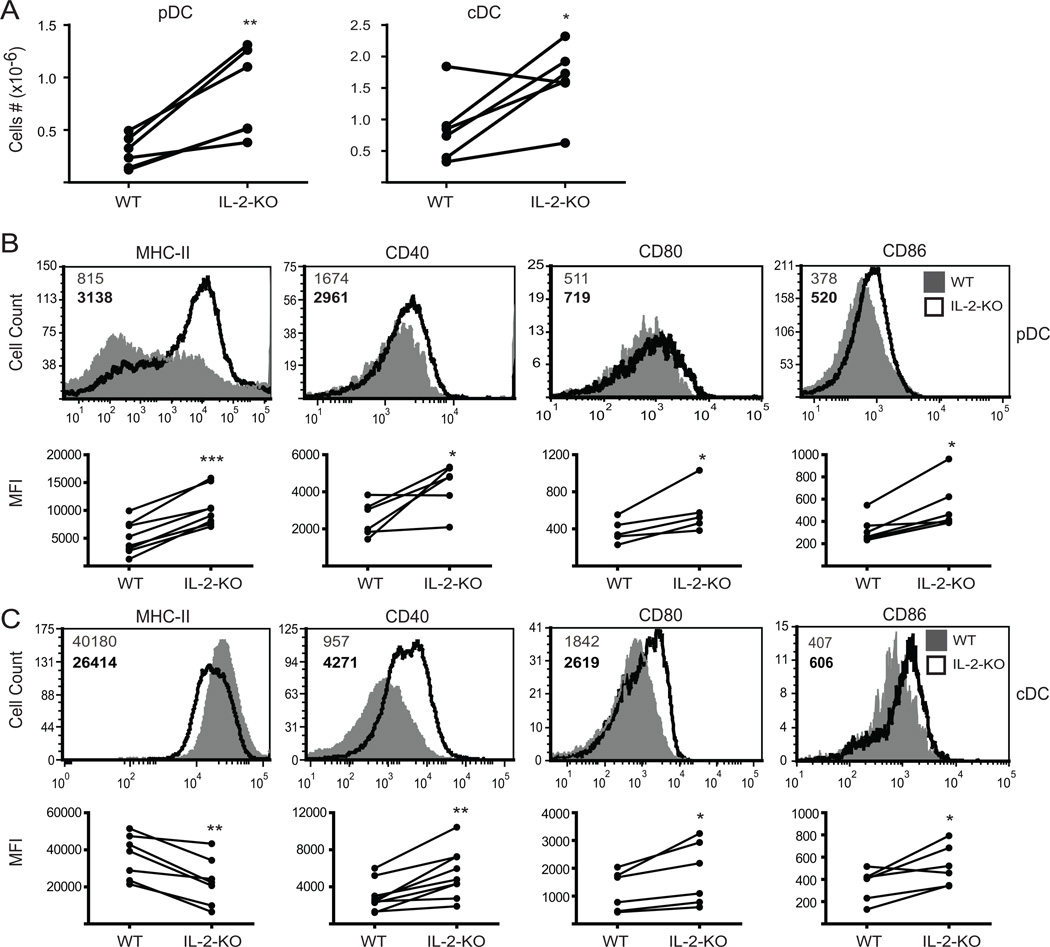
Figure 2. DCs are activated and expanded in the absence of IL-2.
Collagenase-treated splenocytes from 18–24 day old WT or IL-2-KO mice were stained and analyzed by flow cytometry. (A) Absolute splenic DC numbers shown as column graphs of 6 individual mice from at least four experiments. (B) Top: FACS profiles of pDCs gated on Thy1.2−CD11clo B220+PDCA-1+ cells. Bottom: Mean fluorescent intensity (MFI) from at least five individual mice. (C) Top: FACS profiles of cDCs gated on Thy1.2−CD11chiB220− cells. Bottom: MFI from at least five individual mice. Numbers in B and C represent the MFI of WT cells (grey upper number) and IL-2-KO cells (bold lower number). Representative FACS data are from 6 individual mice and at least four experiments. *, p<0.05; **, p<0.01; ***, p<0.001.

