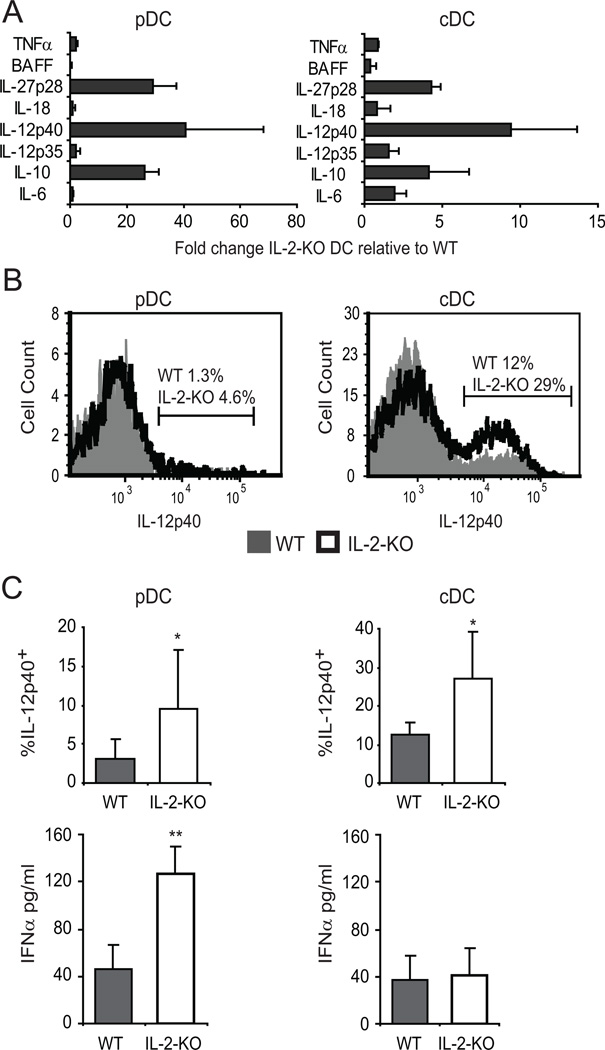
Figure 5. IL-2-KO DCs produce elevated levels of Th1-inducing cytokines.
DCs were sorted on a MoFlo from 18–23 day old mice, stimulated with 5 µg/ml CpG (pDC) or 1 µg/ml LPS (cDC) for 24 hours. (A) mRNA was isolated from the DCs and cytokine mRNA analyzed by real-time PCR. Data are from at least four experiments with DCs pooled from at least three mice per experiment. (B) IL-12/23p40 production was measured by intracellular staining. Bar graphs show cumulative data from three individual mice and three experiments (C) IFNα secretion in culture supernatants was measured by ELISA. Data are from three experiments with DCs sorted from at least three pooled mice per experiment. *, p<0.05; **, p<0.01.

