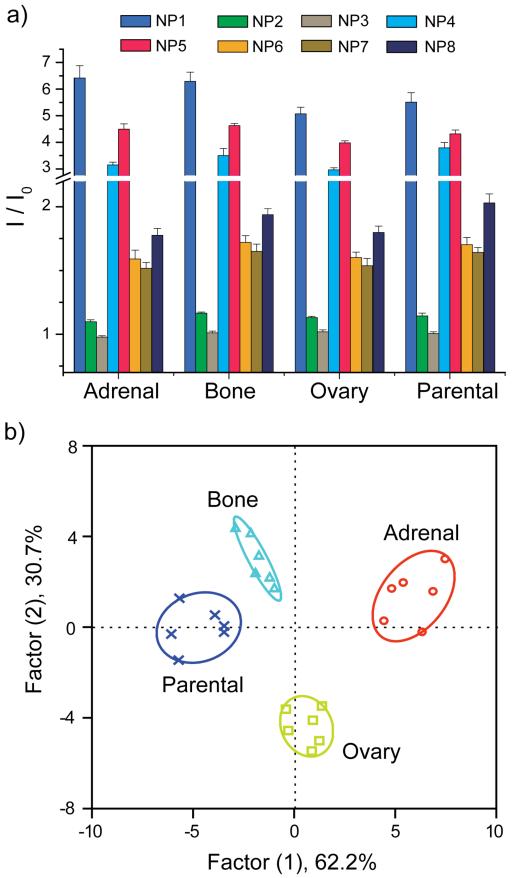
Figure 3.
(a) Ratio of fluorescence intensities after (I) and before (I0) addition of the different metastatic cell lysates to the NP-GFP supramolecular complexes. The responses are averages of six replicate data and the error bars represent the standard deviations. (b) Canonical score plot for the fluorescence patterns as obtained from LDA against different parental and sublines.

