
Figure 1. Integrated view of mesenchymal signature genes regulated by copy number, methylation, and miRNA.
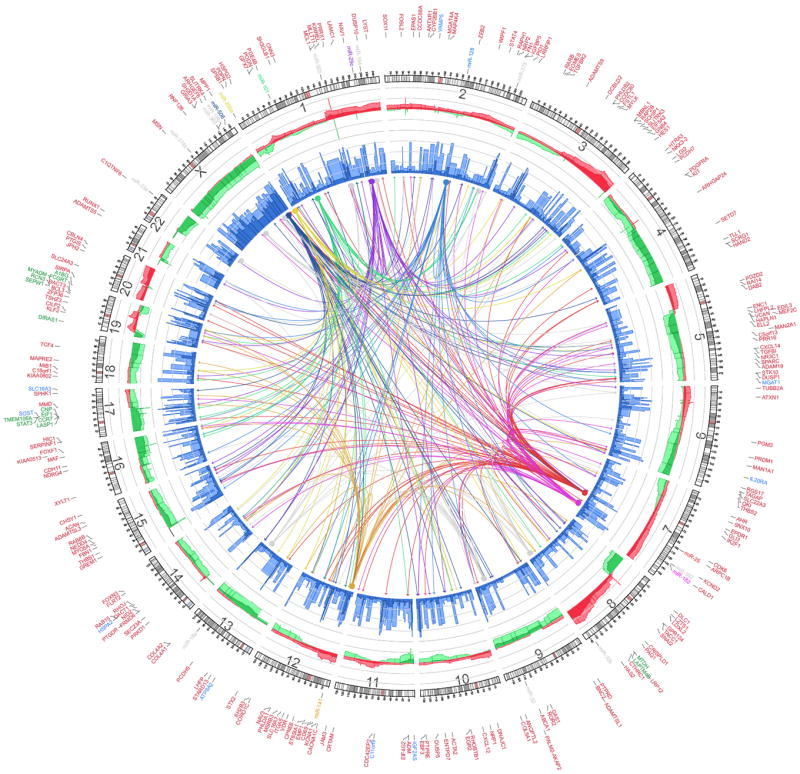
Integrated Circos plot shows mesenchymal signature genes regulated by copy number (CN), methylation, and miRNA. An ideogram of a normal karyotype is shown in the outer ring. The next outermost ring represents copy number as a function of genomic coordinates. (Red represents amplification and green represents deletion. Dark red and dark green indicate median CN values across all patients, and lighter red and green indicate the 25th and 75th percentiles. The vertical axis ranges from -1 to +1 on a log2 scale.) The next ring represents the amount of DNA methylation: dark blue indicates the median methylation beta value, and light blue indicates the 75th percentile. The vertical axis ranges from 0 to 1, and methylation data are averaged using variable-width bins along the genomic axis (25 CpG probes per bin). In the center of the figure, each arc indicates a predicted regulatory relationship between a miRNA (solid circle) and a gene (arrow). The colored arcs represent predicted regulation by the eight key miRNAs, whereas the grey arcs represent regulation by the remaining 11 miRNAs. Outside the ideogram, the miRNAs are colored the same as the corresponding arc. Outside the miRNA labels are the miRNA-associated genes (red), CNA-associated genes (green), and methylation-associated genes (blue). Detailed information on each group of genes is listed in Supplemental Table 1. See also Figure S1