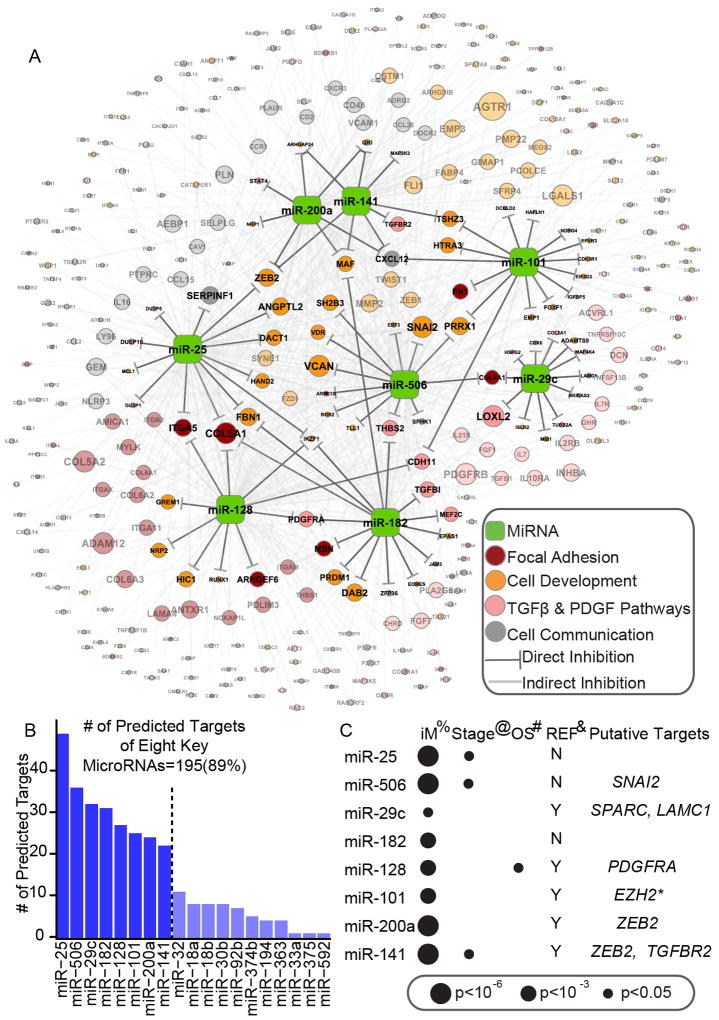
Figure 3. Core miRNA-gene network, including 8 key miRNAs and their targets.
(A) The miRNA-gene network shows the relationships between 8 key miRNAs and EMT signature genes they are predicted to regulate. The size of each gene node indicates the number of predicted key miRNAs regulators; the colors indicate the annotated function of the gene. Only genes with GO and KEGG annotations are shown in this network. (B) A histogram reveals the number of predicted targets for each of the 19 miRNAs. (C) The association between key miRNA expression and clinical information, as well as miRNAs’ putative functional targets in terms of EMT inhibition. %: The significance of differential expression between iM and iE subtypes, as estimated by the Wilcoxon signed-rank test. Detailed information is listed in Table S4. @: The significance of miRNA expression’s association with clinical stage, as estimated using Spearman’s rank correlation coefficient. #: The significance of miRNA expression’s association with overall survival (OS), as estimated using the Cox proportional hazards model. *: Reported by (Carvalho J et al. 2012). See also Figure S3 and Table S3

