
Figure 4. Overexpression of miR-506 in OvCa cells is sufficient to induce epithelial phenotype.
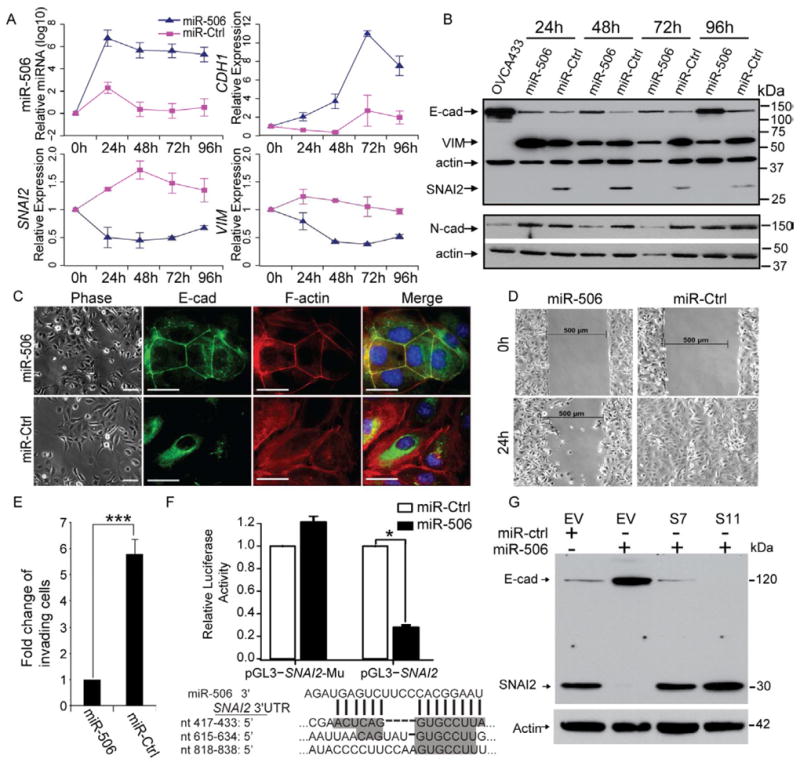
(A) Changes in microRNA and mRNA levels in SKOV3 cells transfected with miR-506 or control miRNA (miR-Ctrl) as measured by real-time RT-PCR (TaqMan). Two independent time course experiments were performed; the average ± standard error (indicated by the error bars) of the two experiments were shown. (B) Western blotting analysis of epithelial and mesenchymal markers in SKOV3 cells transfected with miR-506 or control miRNA (miR-Ctrl) from the same transfection as in panel A. OVCA433 cell lysate was used as the positive control for the epithelial marker E-cadherin. One mesenchymal marker, N-cadherin (N-cad), was measured on a different blot. Both blots were re-probed with actin to control for protein loading. (C) Inverse phase microscopy (left panel) and E-cadherin and F-actin staining (right panels) of SKOV3 cells transfected with miR-506 or control miRNA (miR-Ctrl) for 72 hours. Cell nuclei were stained with DAPI. Scale bars represent 50 μm. (D) Wound healing assay. Cells from the same transfection as in panel C were seeded into the μ-Dish 35mm, high culture-insert and a wound was applied at 48h post-transfection. (E) In vitro invasion assay Cells from the same transfection as in panel C were seeded into triplicate mitrigel coated invasion chambers at 48 h post- transfection and allowed to invade toward serum for 22 hours. The invading cell numbers on each filter were counted and data were plotted in fold change by defining the number from miR-506-transfected cells as 1. Error bars represent ± SD. (F) The relative luciferase activities were shown from three independent experiments (upper panel). The pGL3-SNAI2 reporter gene has the full length of SNAI2 3’-UTR cloned into pGL3- control vector. The pGL3-SNAI2-Mu vector has the three miR506 binding sites deleted and confirmed by sequencing. SKOV3 cells were transfected with pGL3-SNAI2 or pGL3-SNAI2-Mu, respectively, together with miR-506 mimics or mimic negative control. The three predicted binding sites of miR-506 were shown in the SNAI2 3’-UTR region (lower panel). Error bars represent ± SD. (G). Overexpression of SNAI2 from expression vector without 3’-UTR abrogates miR-506’s induction of E-cadherin. Two SKOV3-SNAI2 stable clones (S7 and S11) and empty vector stable cells (EV) were transfected with miR-506. Whole cell lysate from each sample was collected at 72h post – transfection and subjected for Western blot. For comparison, the levels of E-cadherin and SNAI2 in the EV cells transfected with mimic negative control (miR-ctrl) for 72h were shown. See also Figure S4