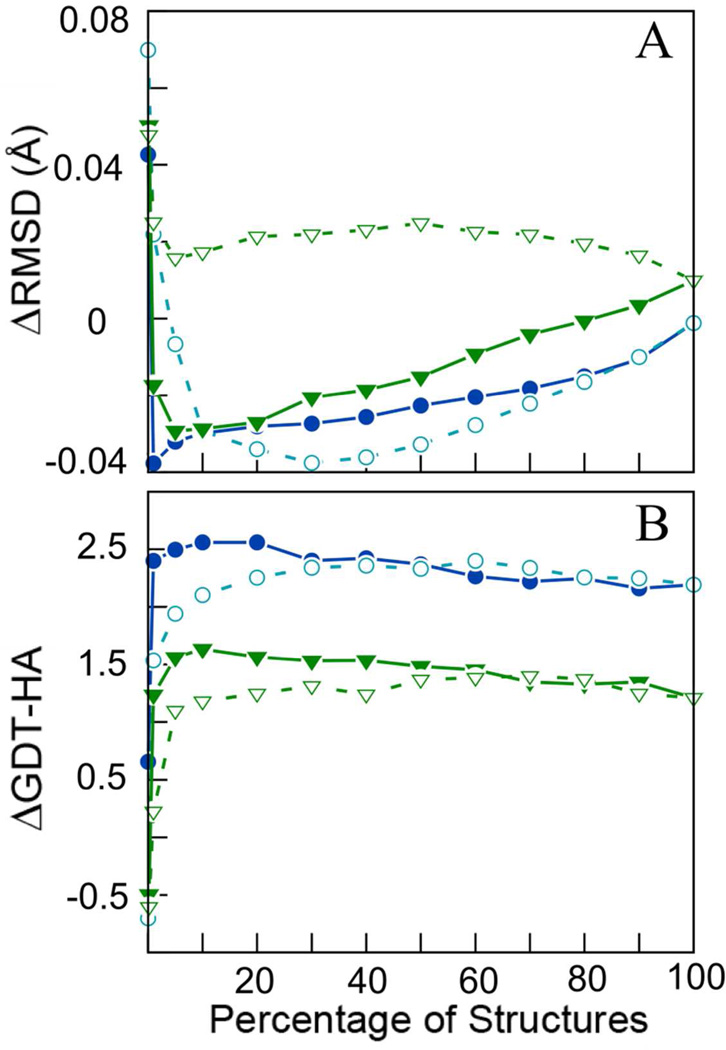
Figure 1.
Change in RMSD with respect to native structure (A) and in GDT-HA (B) upon averaging different subsets of structures sorted by either DFIRE scores or iRMSD. Results from the 200 ns MD runs are shown in blue (circles) and from 8×3 ns sampling in green (triangles). Open symbols denote iRMSD-based selection; closed symbols refer to DFIRE-based selection.

