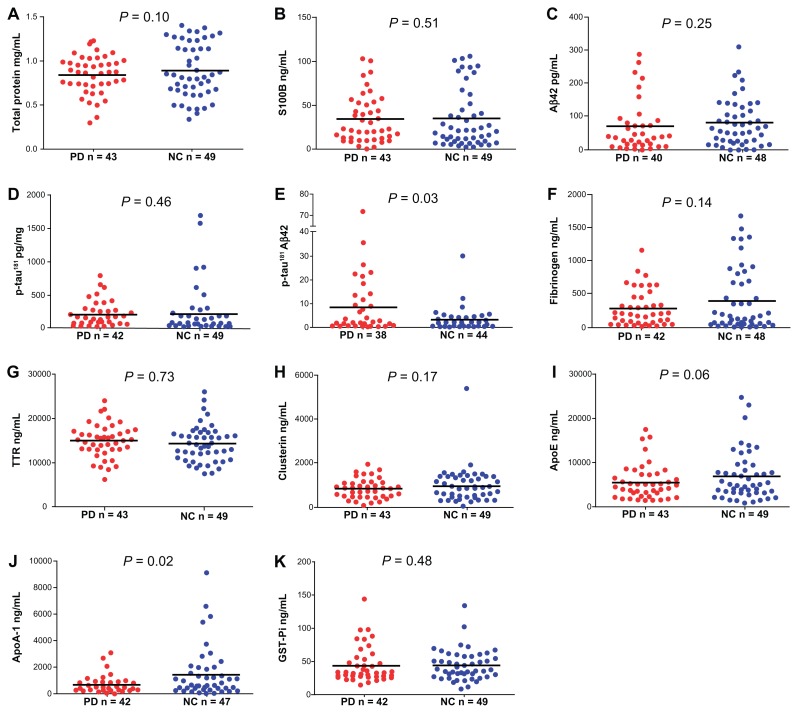
Figure 1.
Scatter plots of total protein concentration and ELISA measurements in CSF. (A) Total protein concentration in mg/mL. (B) S100B concentration in ng/mL. (C) Aβ42 concentration in pg/mL. (D) p-tau181 concentration in pg/mL. (E) p-tau181/Aβ42 ratio. (F) Fibrinogen concentration in ng/mL. (G) TTR concentration in ng/mL. (H) Clusterin concentration in ng/mL. (I) ApoE concentration in ng/mL. (J) ApoA-1 concentration in ng/mL. (K) GST-Pi concentration in ng/mL.
Notes: Mean values are indicated by the horizontal line. Results of the statistical analyses are given in Table 2.
Abbreviations: PD, Parkinson’s disease; NC, normal control; Aβ42, amyloid-beta 42; p-tau181, tau phosphorylated at amino acid 181; TTR, transthyretin; ApoE, apolipoprotein E; ApoA-1, apolipoprotein A-1; GST-Pi, glutathione S-transferase Pi.

