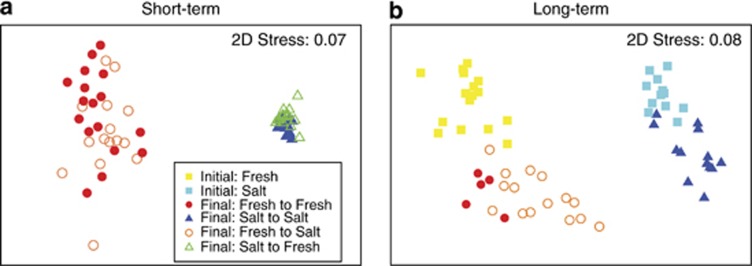
Figure 3.
NMDS (nonmetric multidimensional scaling) plots representing the Bray–Curtis similarity of general bacterial communities (on the basis of 16S rDNA T-RFLP profiles) in the sediments (a) at the end of the short-term experiment and (b) at the beginning (initial) and end (final) of the long-term experiment. The x-axis in both panels largely differentiates the communities by sediment origin. The y-axis in panel (b) differentiates the communities by the time of sampling (initial versus final samples).

