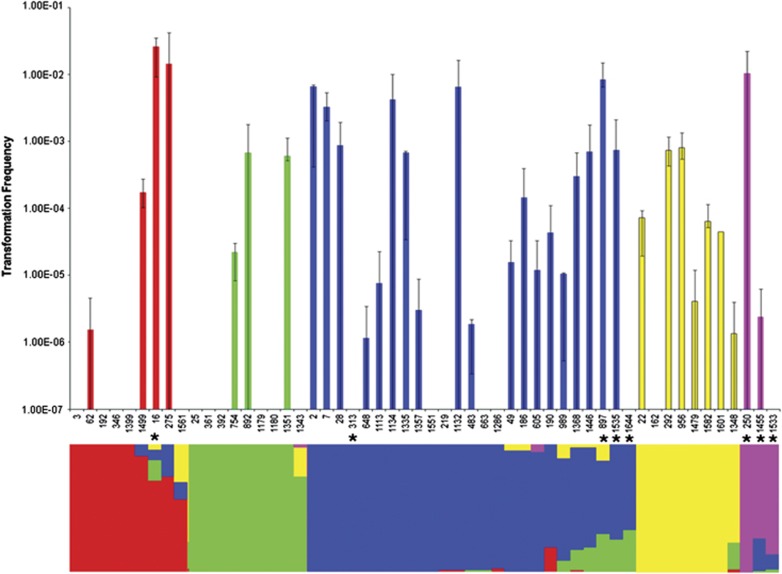
Figure 1.
Top; isolate transformation frequencies. Error bars represent 95% CIs. Bottom; population structure as estimated using BAPS. The bar for each isolate is subdivided to indicate the relative genetic contribution that the isolate carries from each of the five populations. Red, population 1; green, population 2; blue, population 3; yellow, population 4; pink, population 5. Asterisks indicate the eight isolates with non-type 1 pherotypes.

