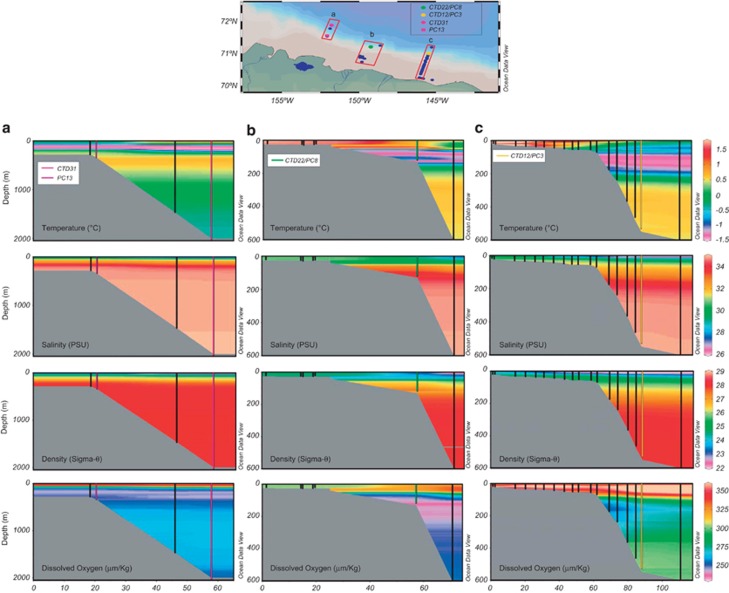
Figure 1.
Hydrographic properties of the ABS. The upper map depicts the three regions sampled (a–c). Lower panels are contour plots of temperature, salinity, density and DO in areas (a–c) from the map. Water column locations used to construct contour plots but not used for discrete sample analysis are depicted as blue dots on the map and black vertical lines in a–c. Piston core (PC) and water column (CTD) discrete sampling locations are identified as colored dots on the map, and vertical lines in panels a–c. Contour plots and map were generated in Ocean Data View.

