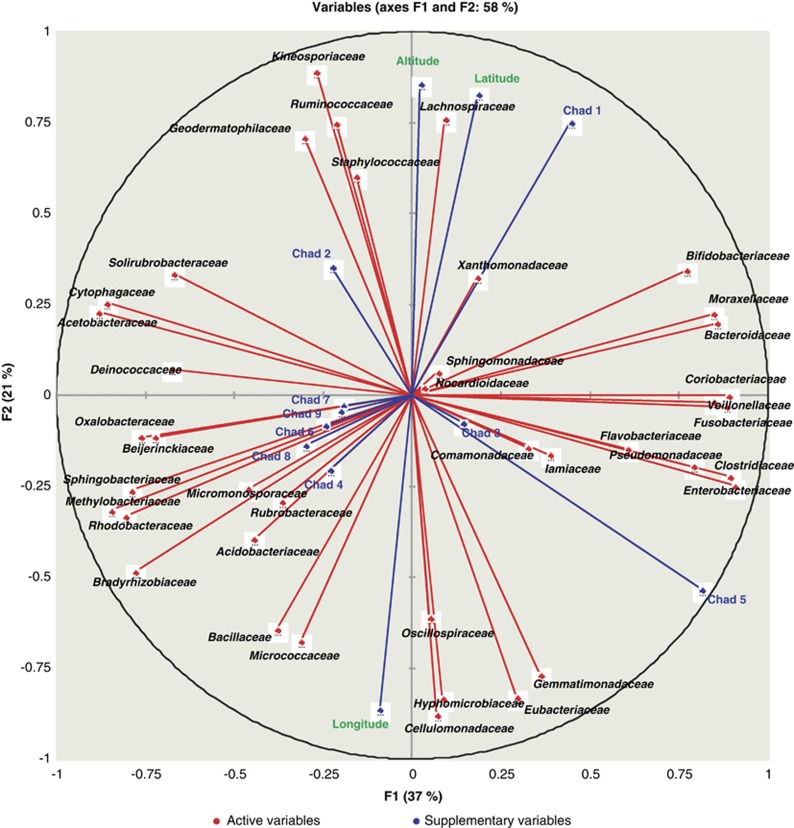
Figure 8.
Principal component analyses were performed on the log10 transformed Spearman rank correlation matrices and used to cluster the 40 most abundant bacterial families found by HtS based methods with the geographical coordinates (altitude, latitude and longitude) of the places where samples C1–C9 were collected (see Table 1). Longer vectors indicate a larger contribution of the variable whereas the closer the variables are to one another, the higher the correlation between them.

