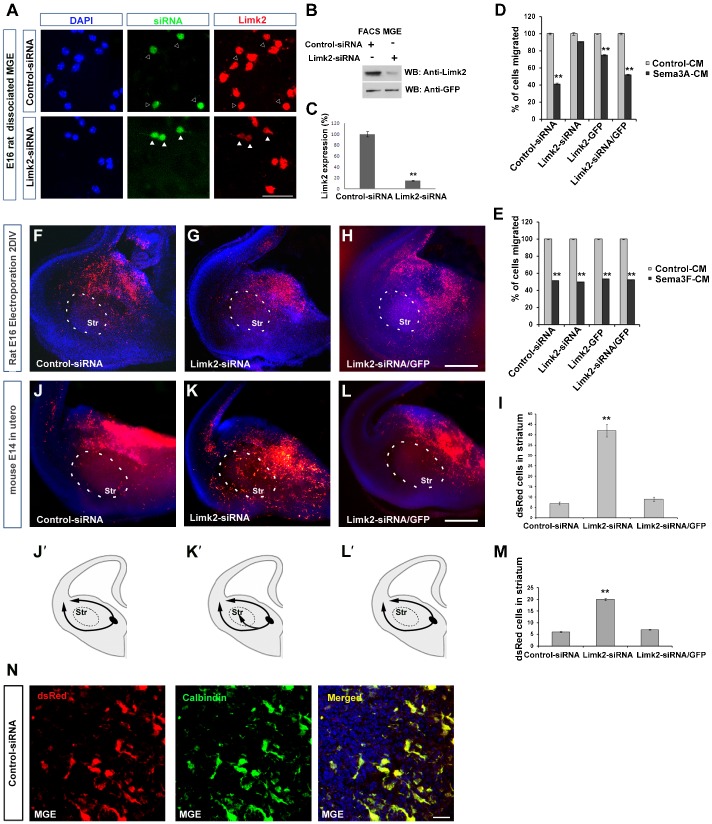
Fig. 2. Lack of responsiveness to Sema3A by Limk2 knockdown in MGE cells.
(A) E16 rat MGE cells were transfected with control or Limk2-siRNA (GFP) constructs. In Limk2-siRNA, GFP+ cells showed reduced level of Limk2 protein (Red) (white arrowheads) compared to control cells (black arrowheads). (B) Immunoblots of FACS purified MGE cells transfected with control or Limk2-siRNA showing reduced levels of Limk2 in the latter. (C) Histogram illustrates efficient Limk2 knockdown. (D,E) Quantification of transfected rat E16 MGE cell migration in a Boyden's chamber containing Sema3A (D), Sema3F (E) or control-CM. (F–H) Migration of MGE cells in E16 rat brain slices electroporated with control-siRNA (F), Limk2-siRNA (G) or Limk2-siRNA/Limk2-GFP (H). (J–L) Migration of MGE cells in a mouse embryo electroporated in utero at E14 with control-siRNA (J), Limk2-siRNA (K) or Limk2-siRNA/Limk2-GFP (L). (I,M) Quantification of electroporated cells (dsRed+) entering the striatum following in vitro (I) and in vivo (M) electroporation. (J′–L′) Schematic representation of the migratory routes adopted by MGE cells electroporated with control-siRNA (J′), Limk2-siRNA (K′), and Limk2-siRNA/Limk2-GFP (L′). (N) Co-localisation of dsRed and Calbindin (yellow) in interneurons within the MGE of control-siRNA in utero electroporated embryo. MGE, medial ganglionic eminence (L′). Scale bars: A, 60 µm; H,L, 200 µm; N, 10 µm. Str, striatum; CM, conditioned media. **P<0.001.

