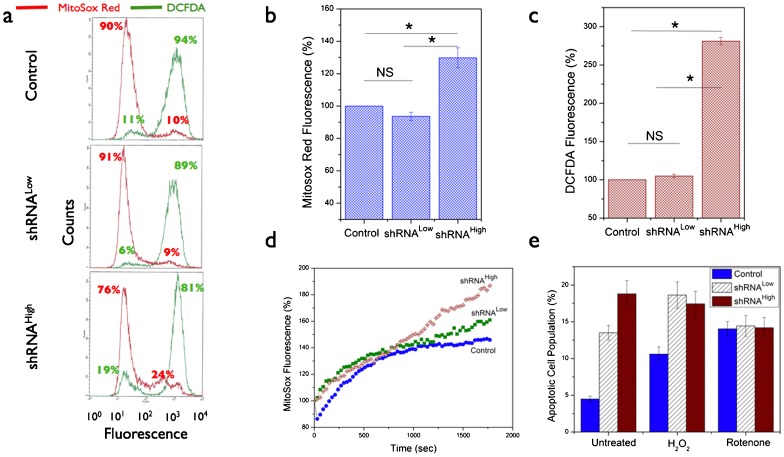
Fig. 6. Basal reactive oxygen species (ROS) data in the NDUFS3-deficient cell lines.
(a) Representative flow cytometry histograms showing the basal superoxide (red lines) and hydrogen peroxide (green lines) signals as measured by labeling the live cells with superoxide selective Mitosox Red (2.5 µM, 20 minutes, 37°C) and hydrogen peroxide-selective DCFDA (2.5 µM, 20 minutes, 37°C) probes. (b,c) Statistical analyses of steady-state ROS status in the control and NDUFS3 deficient cell lines obtained from at least three independent experiments (P<0.001 and NS denotes Not Significant). (d) Live cell kinetics imaging analysis of real-time superoxide generation rate measured in live cells pre-labeled with 2.5 µM Mitosox Red. The time-lapse imaging was initiated after adding 100 nM rotenone (mitochondrial complex I inhibitor) to monitor the superoxide generation kinetics. Fluorescence values in each case were normalized with respect to the fluorescence at t = 0 seconds and presented as percentage change in fluorescence for the three cell lines studied. These kinetic profiles were representative of three independent experiments under identical imaging conditions. (e) Apoptotic cell population determined under exogenous generic ROS inducer, hydrogen peroxide (25 nM H2O2, 14 hours, 37°C) showed similar response trend in the control and shRNALow cell lines whereas the shRNAHigh cell lines had constitutively higher apopotic cell death even without treatment further substantiating the effects of sustained oxidative stress in these cell lines. Mitochondrial complex I inhibitor (100 nM rotenone, 14 hours, 37°C) was also used in this experiment to demonstrate that apoptotic rates could be regulated by ROS status independent of the source of oxidative stress.

