
Fig. 2. Morphological analysis of acentriolar mitotic spindles.
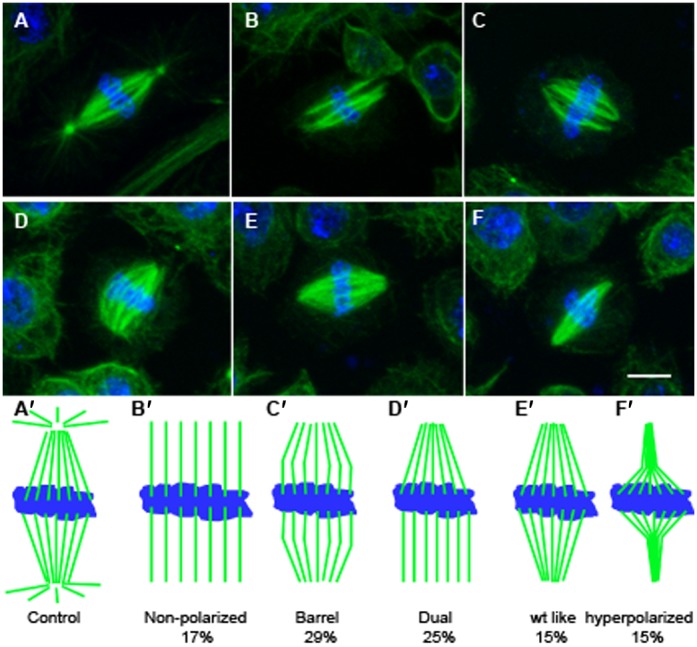
Immunofluorescence on fixed cells. (A) A typical mitotic spindle from control cell, well polarized with many astral MTs. Centrosomes are evidenced at the two poles as a spherical structure. (B–F) Images of the various types of acentriolar spindle morphologies encountered, ranging from non-polarized (B) to extreme polarization (F). The most frequent acentriolar spindle type is represented in (C), with a barrel-shaped appearance. In all cases, there is none or only very few astral MTs and no centrosome-like structure detectable. Blue: DNA, Green: α-tubulin. Scale bar: 5 µm. (A′–F′) Schematic representation of the different mitotic spindles shapes observed either in control (A′) or in the acentriolar line 131 (B′–F′), with percentages of each category (n = 132).