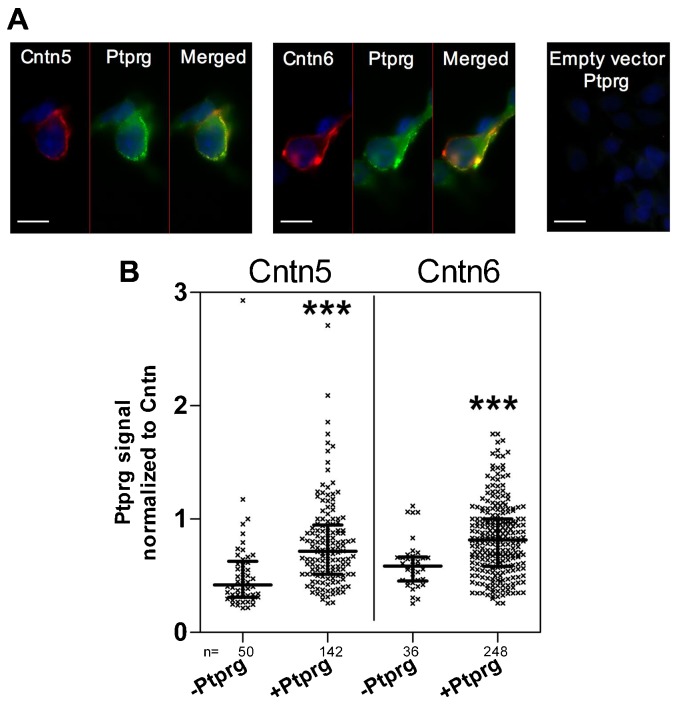
Fig. 7. Binding of Ptprg to HEK293 cells expressing the rat Cntn5 or Cntn6.
HEK293 cells were transfected either with Cntn5 or Cntn6 cDNAs. Two days post-transfection, cells were incubated with Ptprg–Fc according to the protocol described in Materials and Methods. (A) In left and middle panels, red signals correspond to Cntn5 and -6, expressed at cell membranes. For Ptprg, positive labeling appears as lines of dots (green). Scale bars = 20 µm. Right panel represents labeling in the absence of Cntn (empty vector) indicating no significant background in the absence of Ptprg binding. Note that the lines of dots are no longer visible. Scale bar = 40 µm. (B) Semi-quantification of fluorescent signals in the absence and in the presence of Ptprg. Binding signals were normalized to Cntn fluorescence for each cell. Numbers of neurons analyzed are indicated in the graphs. Statistical analysis was performed using a Student's t-test. ***P<0.001.

