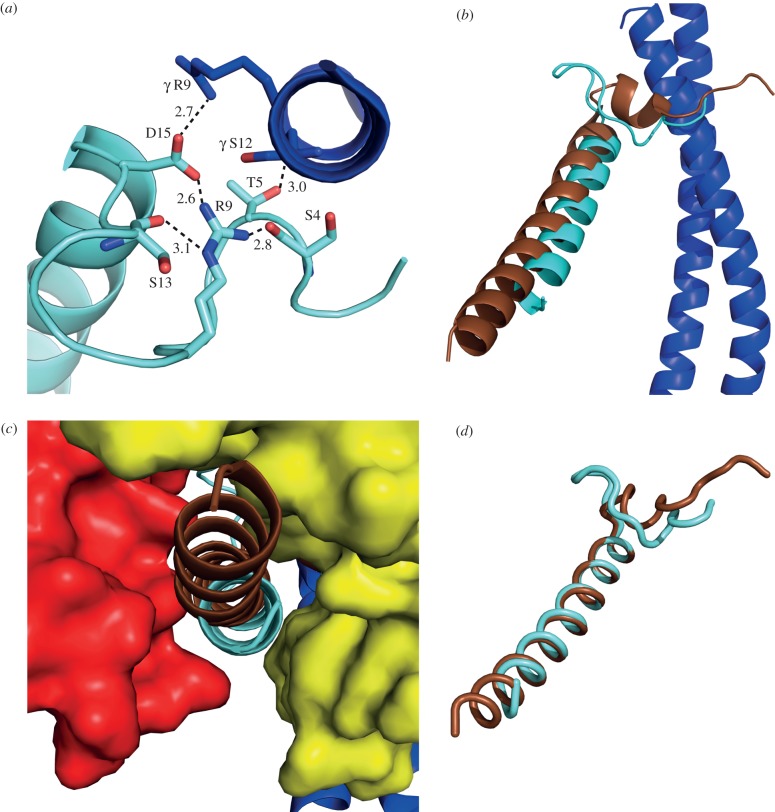
Figure 4.
The binding site for yeast I1–53 in the structure of yeast F1-ATPase. (a) The N-terminal loop region of the inhibitor protein (light blue) in juxtaposition with the C-terminal helix of the γ-subunit (dark blue). Dotted lines represent possible interactions with distances in angstrom. (b) View from the side of the central stalk showing the orientations of the yeast and bovine inhibitor proteins (light blue and brown, respectively) relative to the central stalk. (c) View from outside the F1-domain towards the γ-subunit of the enzyme (dark blue) of the deep cleft between the C-terminal domains of the αDP- and βDP-subunits (red and yellow, respectively) where the α-helical region of I1–53 (light blue) is bound. The position of the equivalent region of the bovine inhibitor protein in the structure of bovine F1-I1–60 is shown in brown. (d) View of the bovine inhibitor (brown) superposed onto the yeast inhibitor protein (light blue) via residues 22–25 and 17–20 in the bovine and yeast inhibitors, respectively.

