
Figure 3.
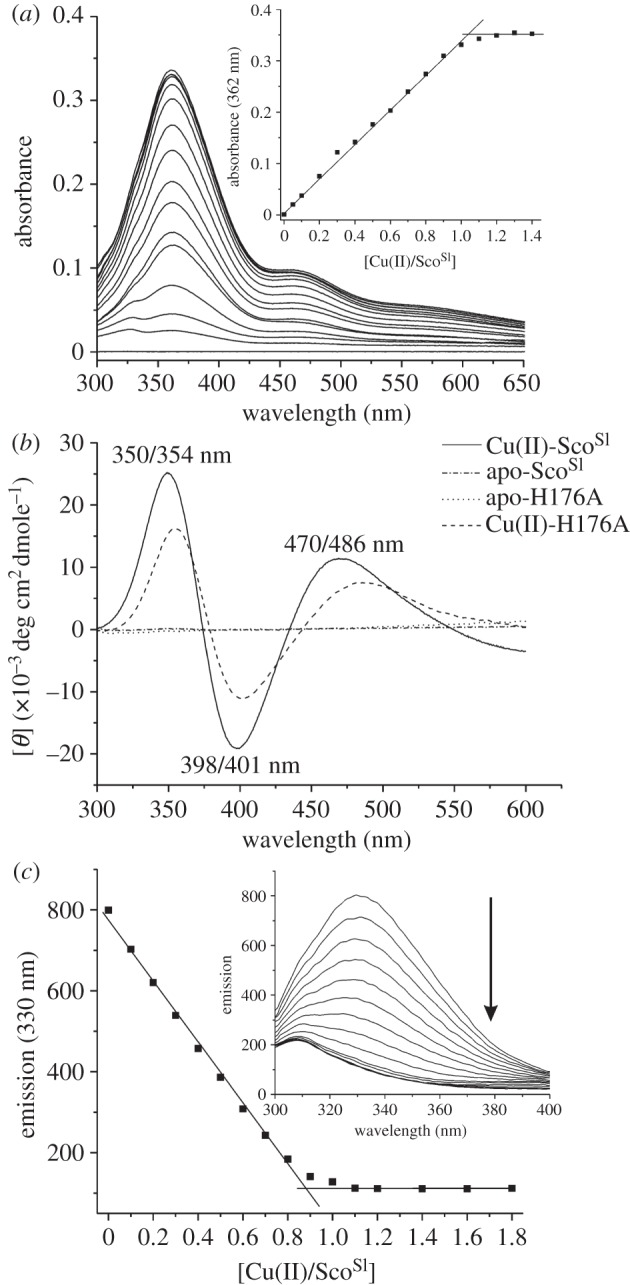
Cu(II) binding to reduced apo-ScoSl. (a) Changes in the UV–vis spectrum (pH 7.5, 20°C) of reduced apo-ScoSl (110 μM) upon stepwise addition of 10 μM Cu(II)SO4. Inset: the change in absorbance at 362 nm plotted as a function of [Cu(II)]/[ScoSl]. (b) Visible CD spectra of Cu(II)-loaded and apo-reduced ScoSl and the H176A mutant. (c) Inset: changes in the Trp emission spectrum (pH 7.5, 20°C) of reduced apo-ScoSl (5 μM) upon titration with 0.5 μM of Cu(II)SO4 with the emission at 330 nm plotted as a function of [Cu(II)]/[ScoSl]. The arrow indicates the direction of the emission change. The stoichiometry of the reaction in both (a) and (c) is indicated by the intersection of the two lines.